


End of 2024 Q3 - Buy, Sell or Hold?
Your Quarterly Guide to the UK Property Market
It’s the time in the calendar when we determine if we should be all be out buying, selling or holding in the UK property market. If you have just stumbled across this blog then well done you, certain riches await. Newbies just need to do some homework here on what this buy, sell or hold model is all about.
As a reminder, the model assigns a score between -3 and 3 depending on the conditions best suited to buying, selling or holding. It is based on the current real-terms price of the average home compared to the historical trend and the current affordability ie how much of the average wage is swallowed up by a mortgage to buy the average home.
This quarter the score in 2024 Q3 is….
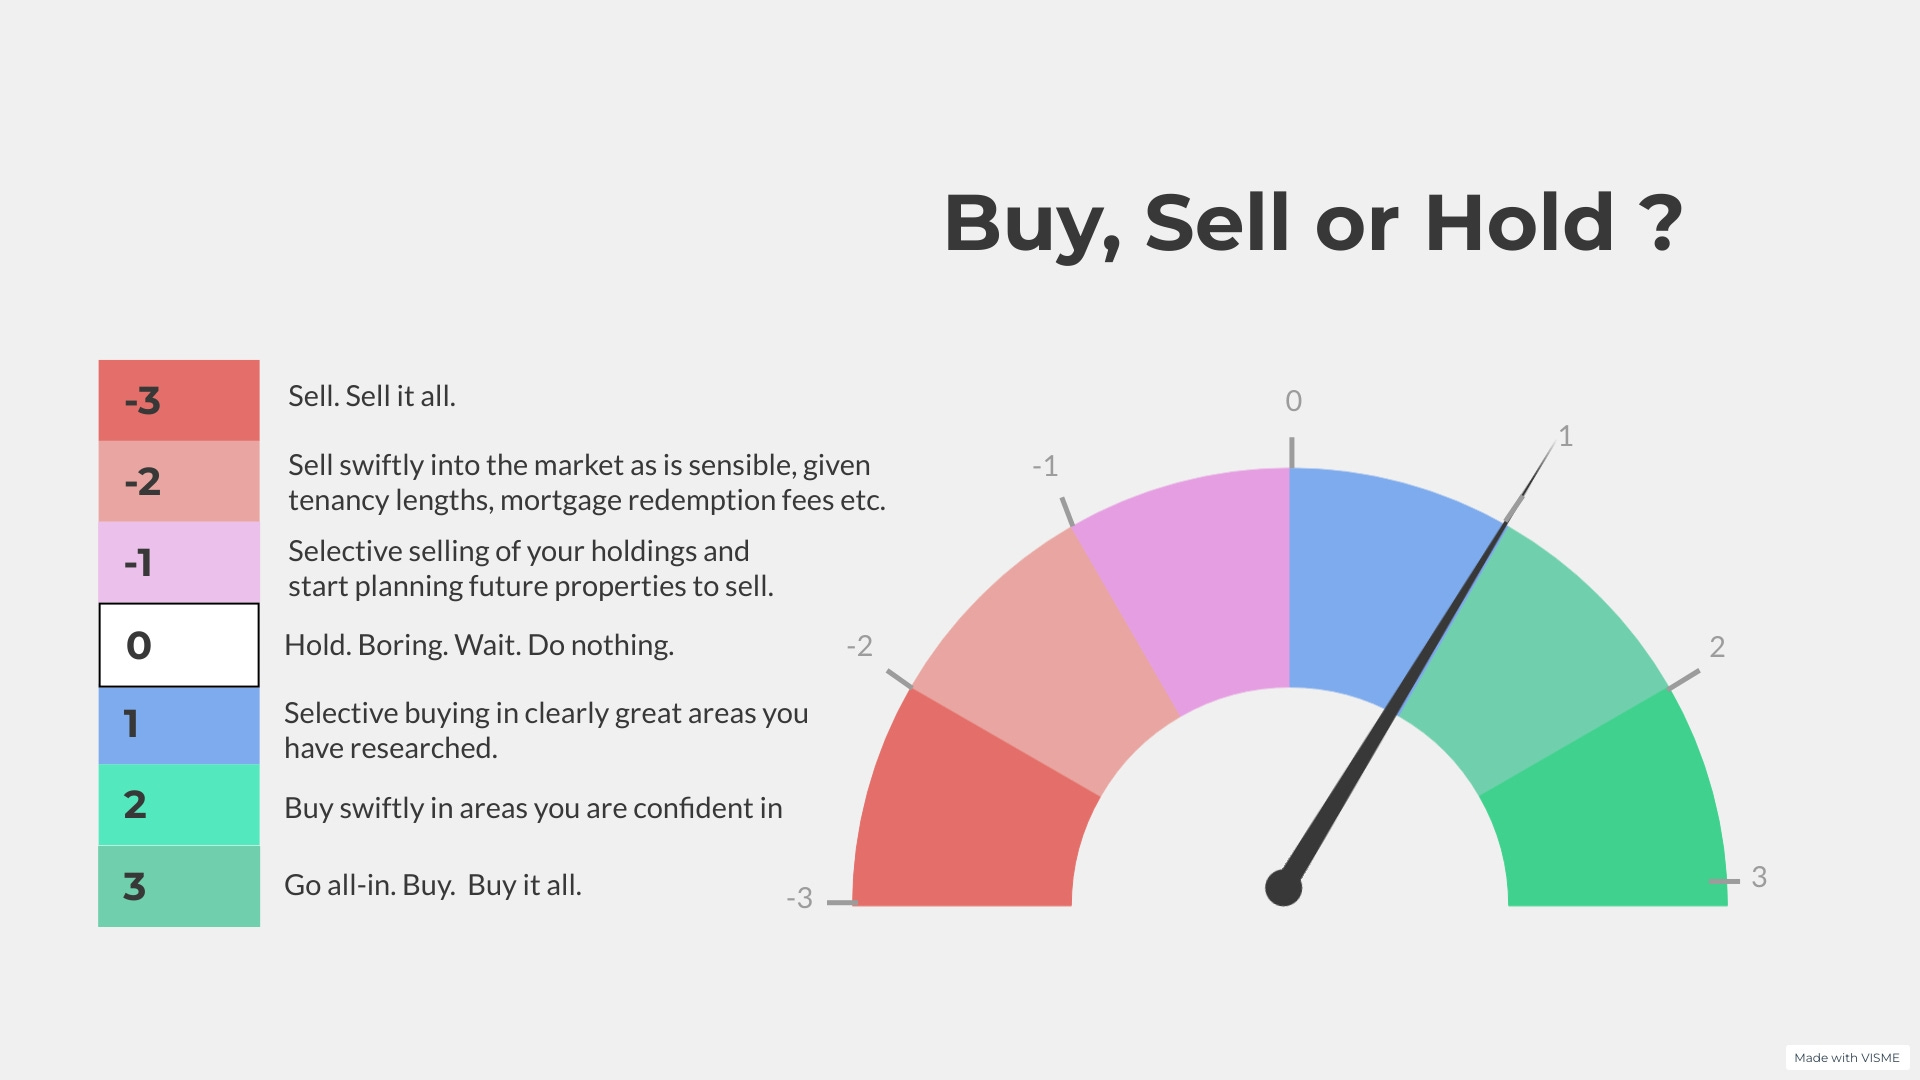
So, we have a (very) weak signal to buy and from the model a score of 1 is defined:
“Selective buying in clearly great areas you have researched.”
For context on how this score looks, the below shows what the model recommended back to 1983.
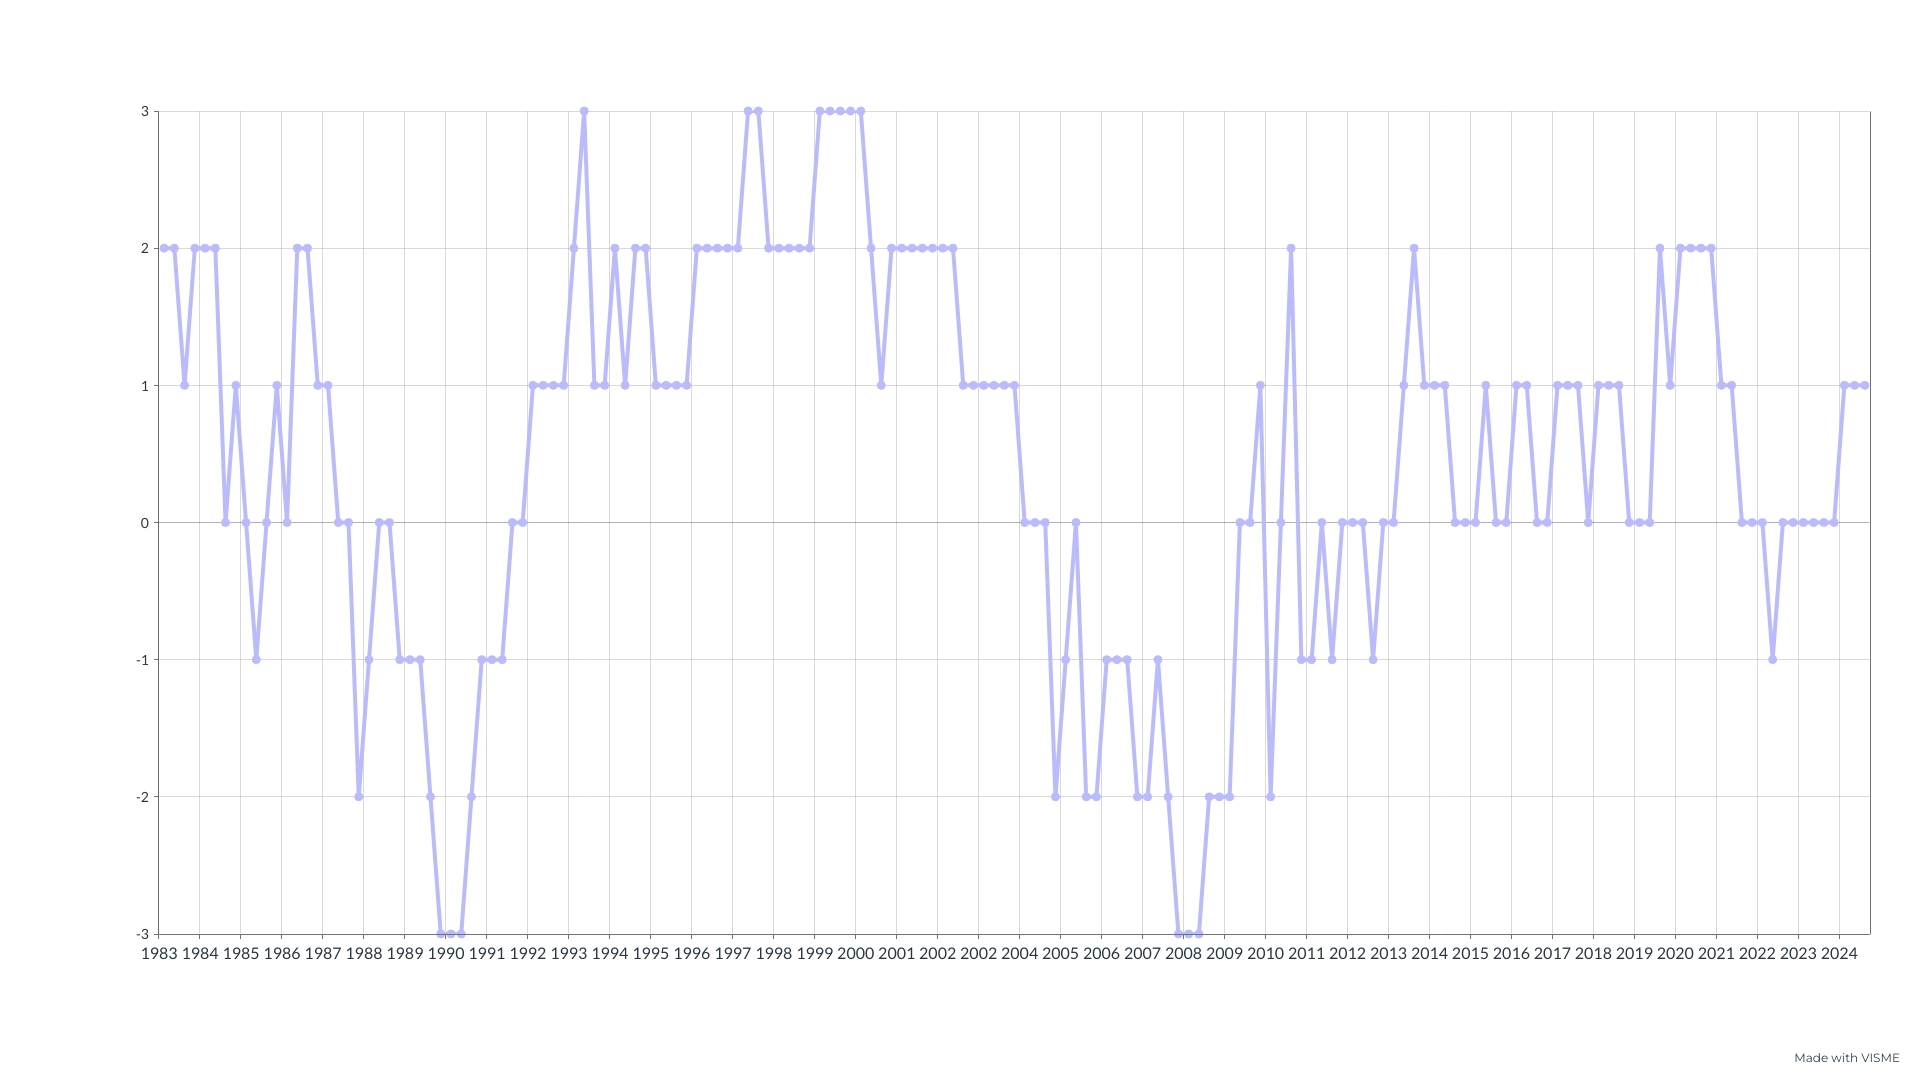
From a historical perspective, a score of 1 is fairly common and has featured for much of this cycle since 2008. More recently, after a short period of sell or hold recommendations, the last 3 quarters have all scored ‘1’ so the signal seems fairly consistent.
As long-time readers will know, the raw data behind this model comes from Nationwide’s quarterly print of real house prices and affordability. Here is their latest graph of real house prices:

In the above graph it’s clear that current real house prices are way below the historic trend line so offer relative value. Also the rate of real house price change, the gradient of the blue line, has flattened which hints at a possible return back up towards the trend line in the coming quarters.
So that all sounds very supportive for new investment however the graph for affordability paints a VERY different picture:
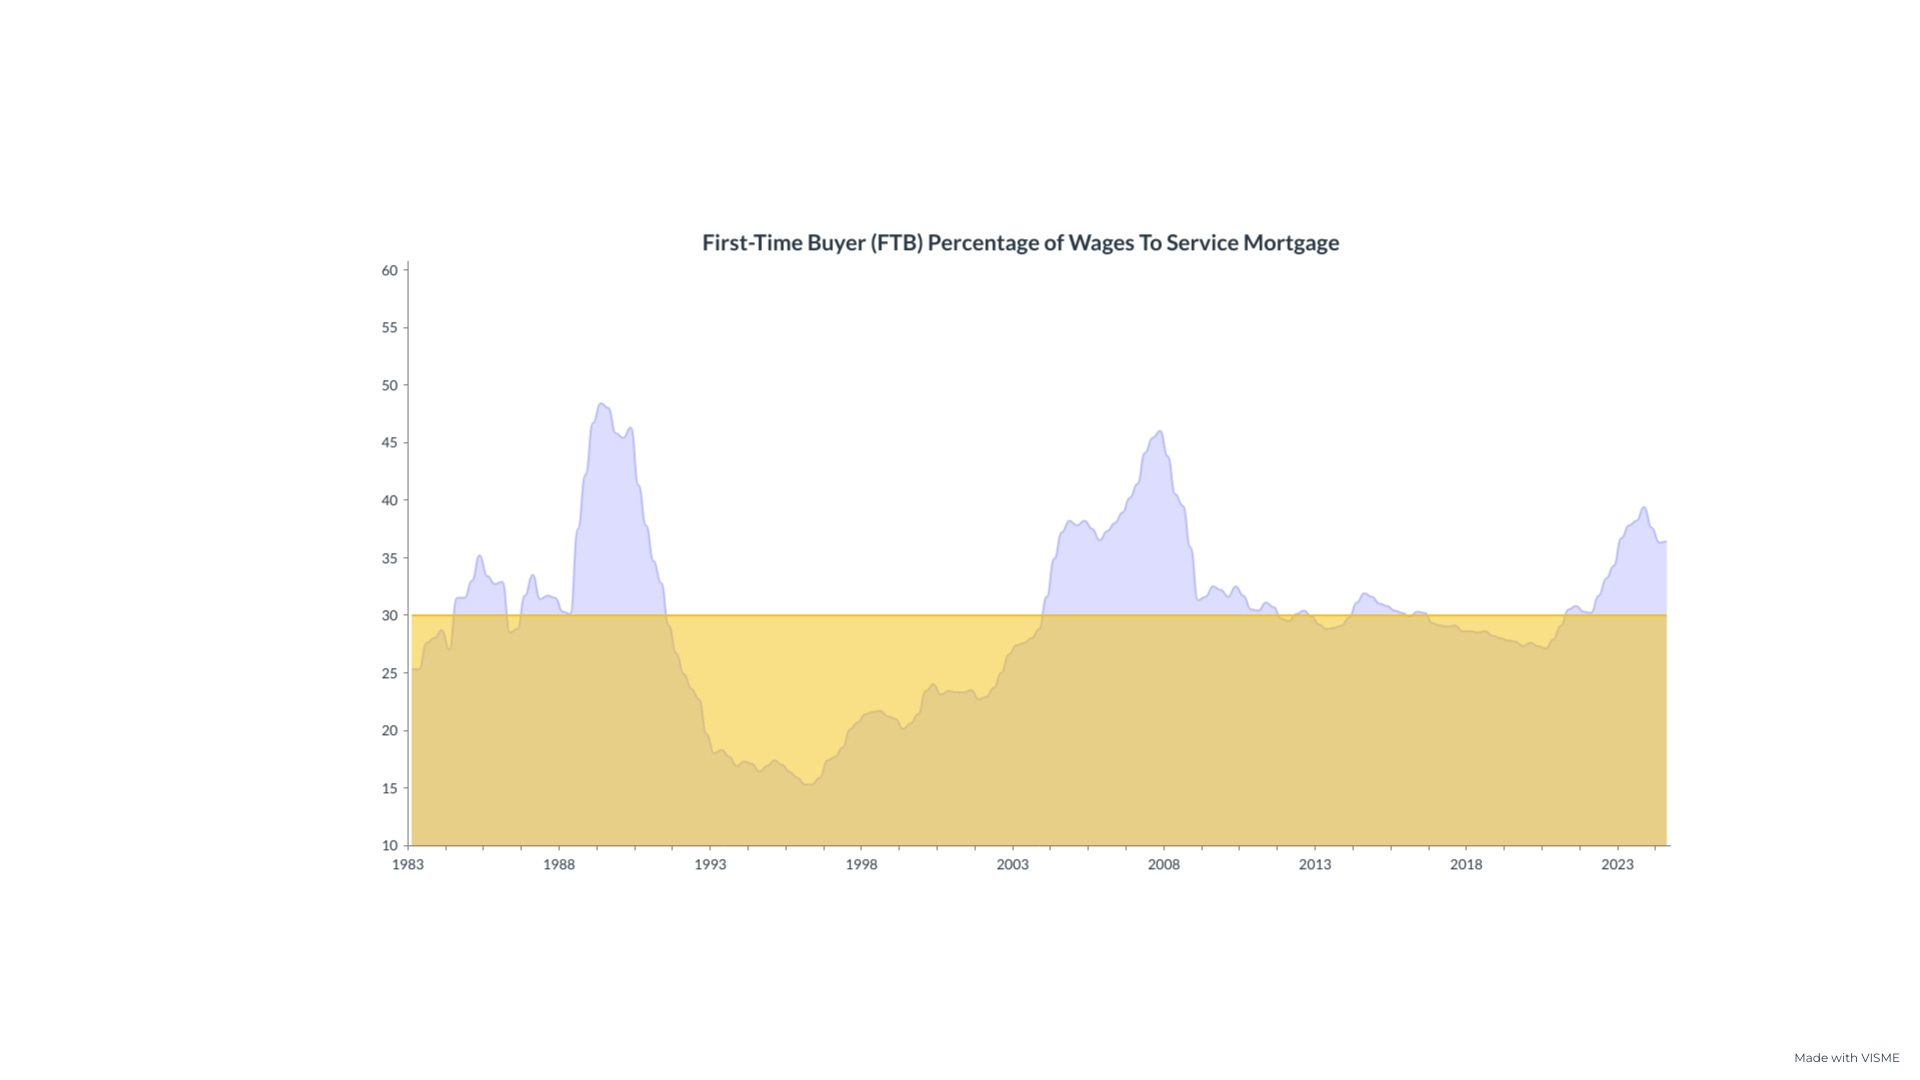
The above graph shows the yellow line at 30% which is the long-term average percentage of a FTB take home pay needed to service a mortgage. From 2010-2022 we had a period of low rates and average or below average mortgage costs with respect to wages. Then we saw a rapid decline in affordability firstly with house prices rising over the pandemic followed by the arrival of Liz Truss and the dramatic rise in mortgage rates. Affordability has been improving through 2024 but still remains historically more challenging for buyers.
More revealing is when we look at the affordability broken down across the regions as this highlights a market with a wide range in potential for future price growth:
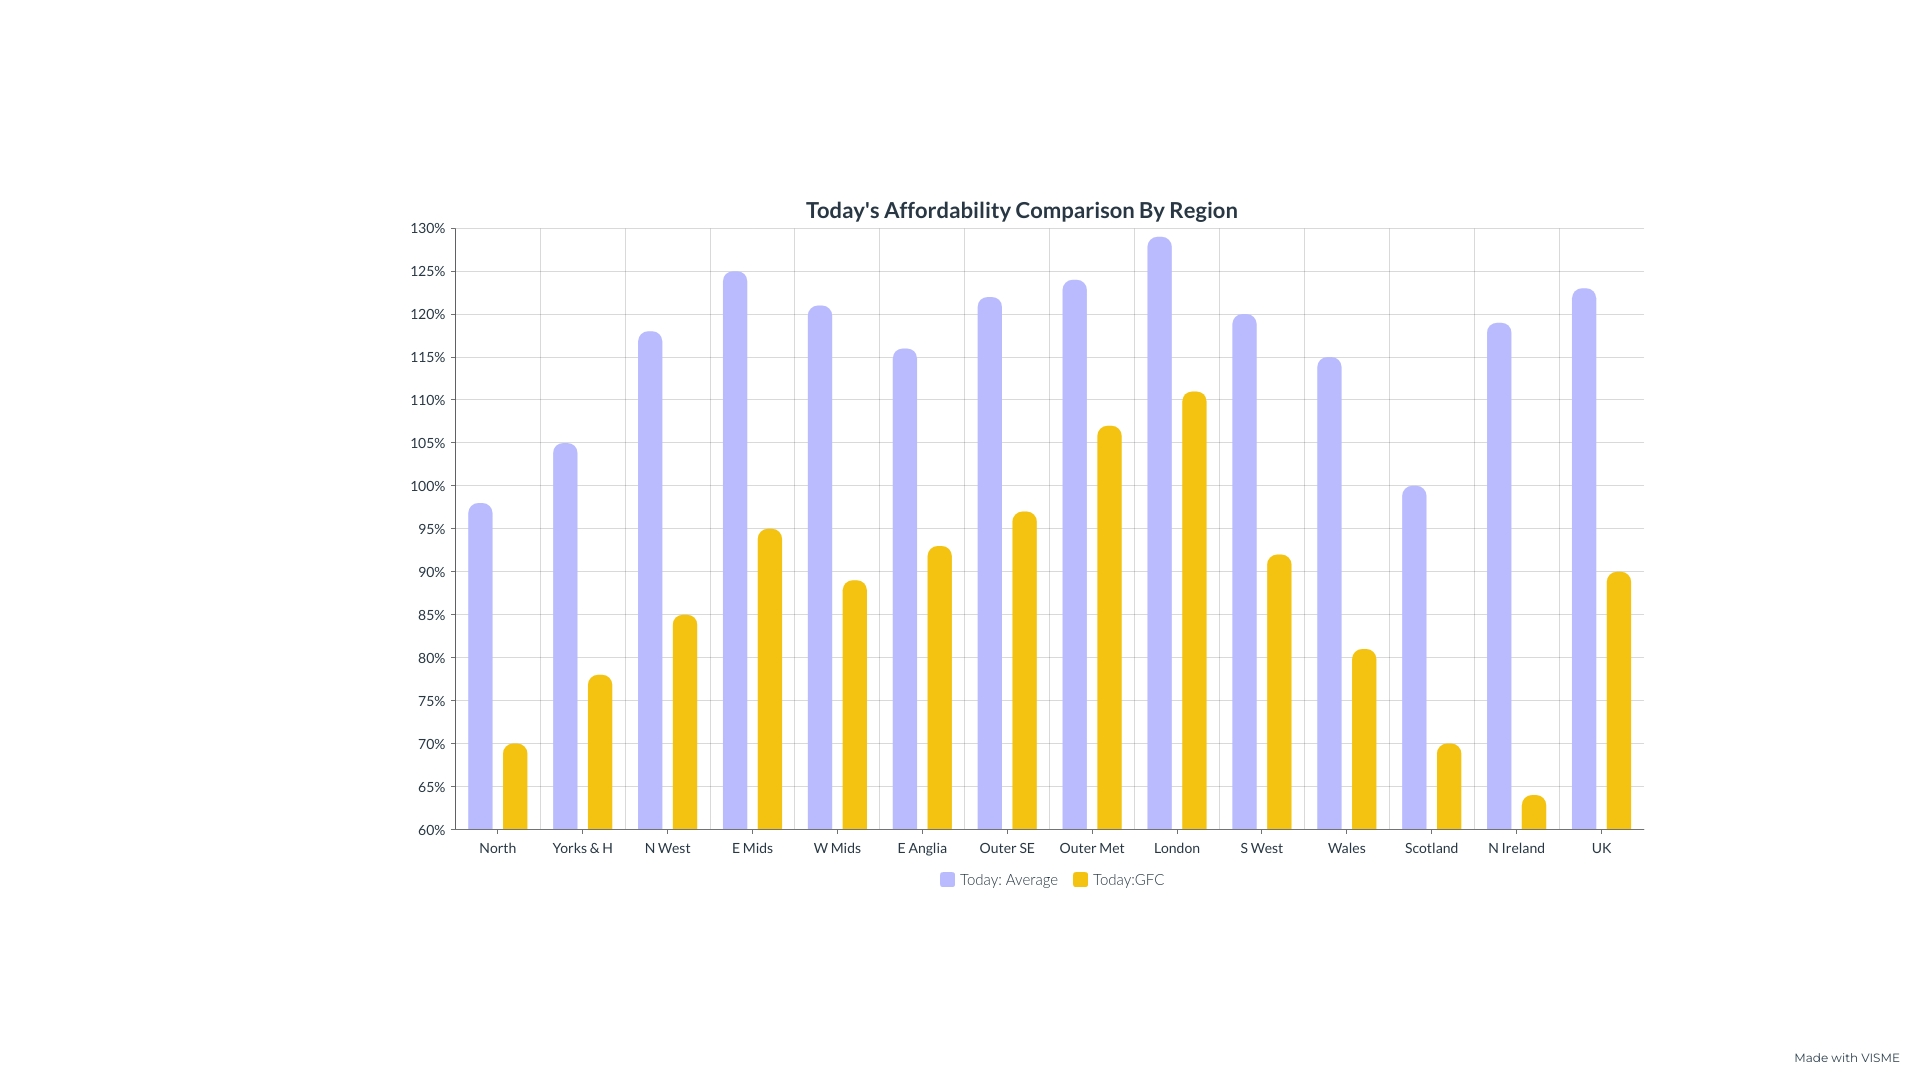
The lilac coloured bars show a measure of today’s affordability with respect to the long term average (since 1983) and the mustard colour bars show today’s level with respect to the peak of the 2007 market. Taking the latter measure, we see London, Outer Met and Outer South East all above or close to the levels of affordability last seen at the 2007 peak. This is a huge concern for investors in these areas as affordability was stretched to breaking point in 2007. These are the areas of high property values and increased mortgage rates have hit these areas very hard of late. This suggests very limited growth potential in London and the SE and perhaps even a further softening of house prices in real terms. Conversely, using the same measure, the areas in the north of England, Scotland and NI all show much better affordability. Indeed, looking at today’s affordability compared to the long-term average, the regions of Scotland and Yorkshire & Humbs are around their average level now with the north of England actually BELOW the long-run average. These areas show very good potential for future price development as mortgage rates seemed to have peaked and now look to soften.
Affordability therefore is overall in the UK is still stretched. However, the picture is mixed with some regions as un-affordable as they have been since 1983 and other regions at or below their long-term average levels.
So, What Should We All Be Buying?
A score of ‘1’ means we need to be taking time to pick out the very best deals. This may mean travelling far from your usual investment area and even then missing out on deals whilst you research them fully rather than just piling in. A score of ‘1’ still indicates a market which is uncertain in terms of short term direction so turning down more deals than you proceed on will be sensible.
To help pick out some great properties for consideration today, I will use the principle of momentum investing. This means looking for an area which has recently experienced a much higher demand and pricing pressure than the average and then jumping on the bandwagon. That is how we will select this quarter’s property ideas. Your job is not to buy these actual units below (unless you are supremely lazy - hats off). Your job is to use these as benchmarks and only close on deals better than these below. Leave any lesser opportunities you come across for the buying frenzy of a ‘2’ or ‘3’ score on the buy, sell or hold model, should we be so lucky.
To see where momentum is right now, we can use the Bricks & Logic tool to look for areas which have performed well since the market peak of summer 2022:

During this tricky post-Truss period, it is clear the midlands and north have weathered the storm well and it’s here where the momentum in pricing lies. We could choose a number of locations but the ‘epicentre’ of this growth looks like Sheffield so we will focus the property ideas this quarter all in this Yorkshire city. This gives me a great excuse to research the city again, I did a blog on the city in 2012 linked here and at the time saw value but dismissed it as an area for investment in favour of nearby Leeds and Manchester. Since then it looks like central property prices have gone nowhere but perhaps now Sheffield’s time has come.
[Click the property pictures for the Rightmove link]
Prime Sheffield Central

I have looked around this conversion, it’s really central but unlike much of the 2000s built stock nearby has no cladding issues so finance is easily available. Prices in here are still around the launch price in 2007, when rents were half of the £1,400-1600 pcm today. Should be great for a mortgaged purchase, you can see a 25% deposit delivering a good total return over a 5-7 year hold period.

Talking of cladding, this development was just launched back on my first visit to the city in 2011 and they are now selling for 30-40% below launch price. New builds rarely do well but this one has no EWS cert in place hence the price, but works are in place to get the certificate. There’s a good deal of stock for sale in this block so a low-ball offer on a high-level apartment (this one is 20th floor) would be the way to go. A nice unit in here should reach £1500 pcm rent, so even 12% gross yield could be possible if played well.

Located in the favoured SW suburb of Greystones, looking at the lounge it seems to be in a great area for mountain biking. Priced at £2500 psm, this is cheap for the area. A basic refurb would help achieve a £1400 pcm rent and should uplift the value instantly in an area which is doing well in any case.
And finally a fixer upper which backs onto the above property. Adding value up front is a good way of de-risking a purchase when the market is less certain as it is today. This goes to auction at half the price of the above almost identical property.

It’s a bit further on than ‘a lick of paint needed’ but if brought up to A1 standard in this prime location for anything near £200,000 would give a low maintenance rental with a good margin of safety in terms of capital value.
Forecast
Real house prices are so far below trend at the moment, almost down to the historic low seen in 1996. The property market NEVER feels cheap at the time however the market is now fundamentally offering good value with a margin of safety. Accordingly, in the short to medium term (3 years or so) we seem very unlikely to get a negative score on the model which would indicate a sell signal. Indeed we should move into a quarter with a score of ‘2’ before too long or even get our first ‘3’ since the turn of the millennium. To get the score to ‘2’ we will need to see house prices beat inflation by a good margin. This may happen within the next 12 months as inflation dissolves back to target.
For a score of ‘3’, we will need to see a dramatic improvement in affordability and that would only really be possible if we see a sizeable reduction in mortgage rates. That’s possible but the swap market is predicting rates to fall only to the 3-4% level in the medium term so a score of ‘3’ is unlikely soon unless we get a black swan type event. I am sure you will agree, we have had enough of black swans for a while.
All in all, we seem to be entering a very good period, possibly one of the best so far in this millennium, to be out property shopping.
Happy Hunting….