


End of 2025 Q1 - Buy, Sell or Hold?
Your Quarterly Guide to the UK Property Market
It’s the end of the quarter and time in the calendar when we determine if we should be all be out buying, selling or holding in the UK property market. If you have just stumbled across this blog then well done you, certain riches await. Newbies just need to do some homework here on what this buy, sell or hold model is all about.
As a reminder, each quarter the model assigns a score between -3 and 3 depending on the conditions best suited to buying, selling or holding. It is based on the current real-terms price of the average home compared to the historical trend and the current affordability ie how much of the average wage is swallowed up by a mortgage to buy the average home.
This quarter the score at the end of 2025 Q1 is….
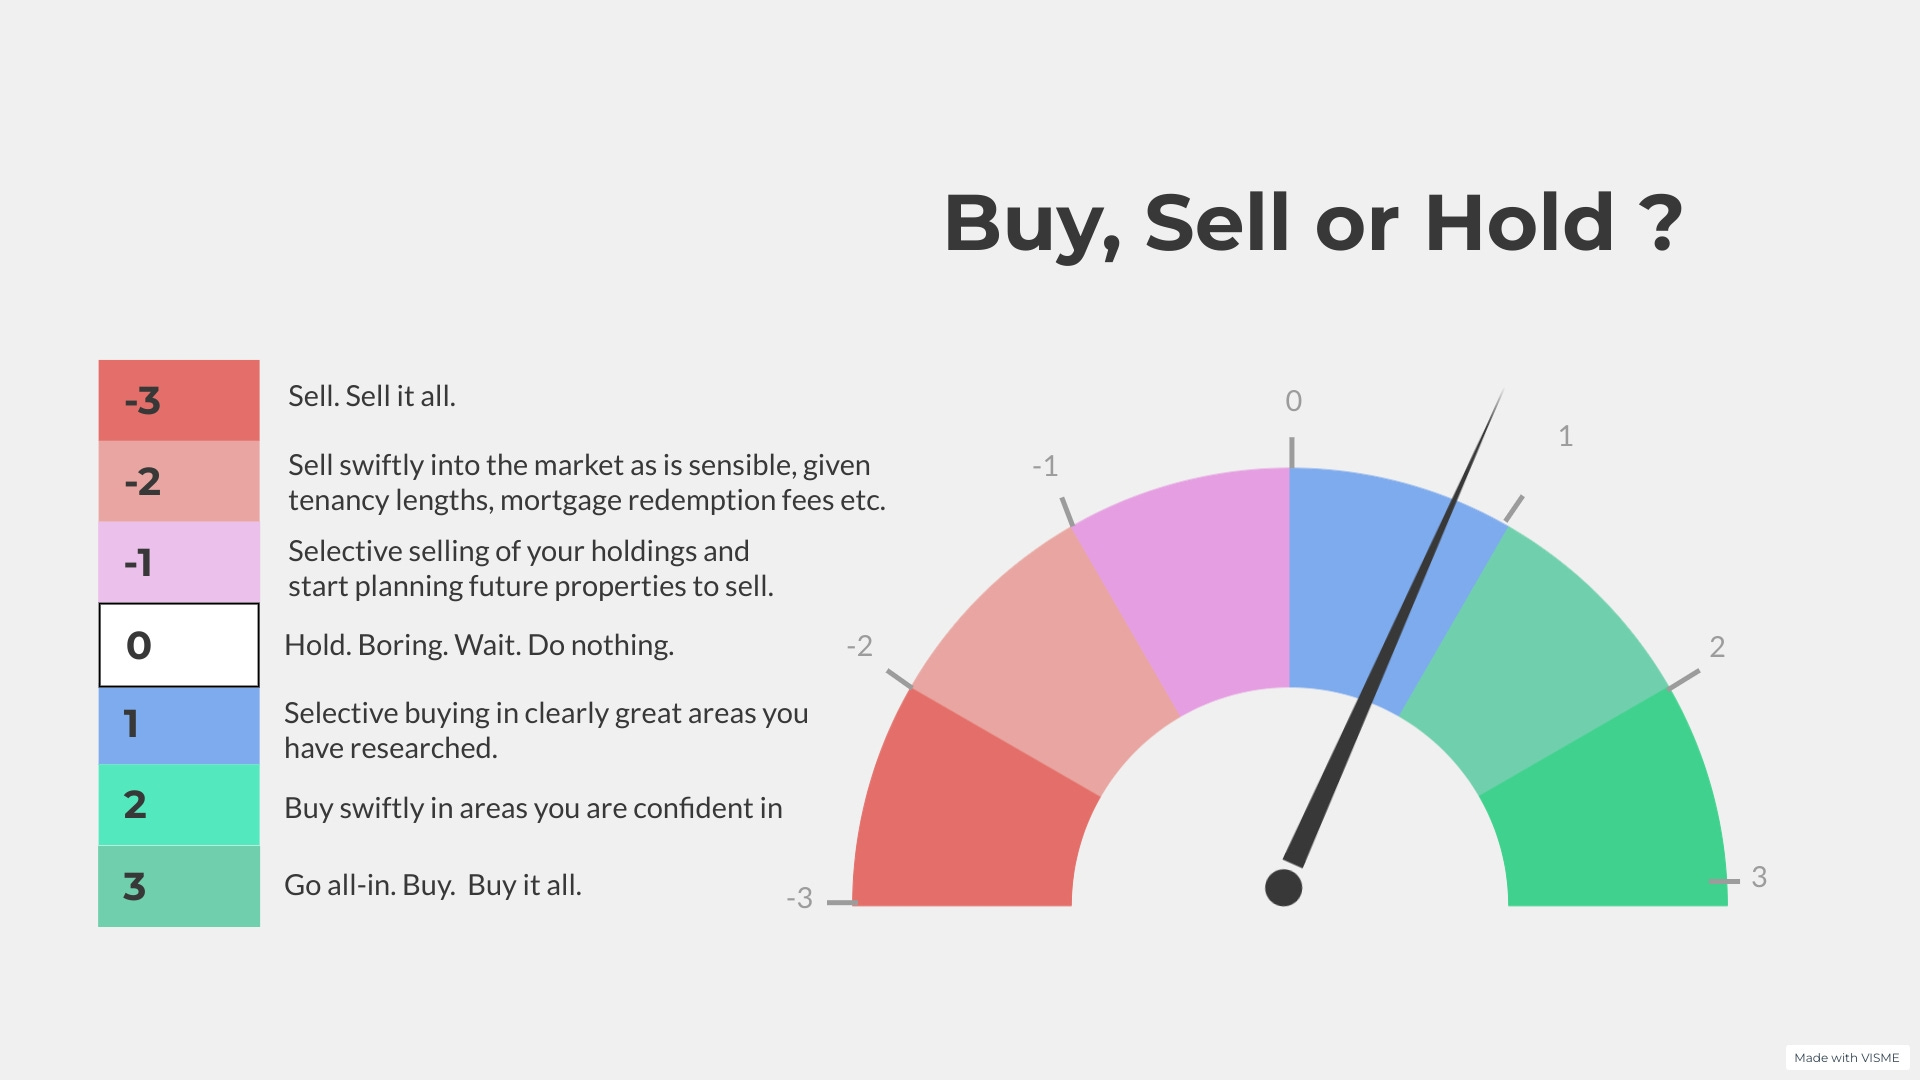
For the fifth quarter on the trot have a weak-ish signal to buy and from the model a score of 1 is defined:
“Selective buying in clearly great areas you have researched.”
As long-time readers will know, the raw data behind this model comes from Nationwide’s quarterly print of real house prices and affordability. Here is their latest graph of real house prices:

From the above graph it’s clear that current real house prices still remain far below the historic trend line and so offer relative value. Since 2022 Q1, real prices have gone from £320,593 to £270,867 a 16% drop and similar in scale to the 2 year period following the 2008 financial crisis. However the rate of real house price change, the gradient of the blue line, has flattened which hints at a possible return back up towards the trend line in the coming quarters.
So that all sounds very supportive for new investment however the graph for affordability still paints a different picture:
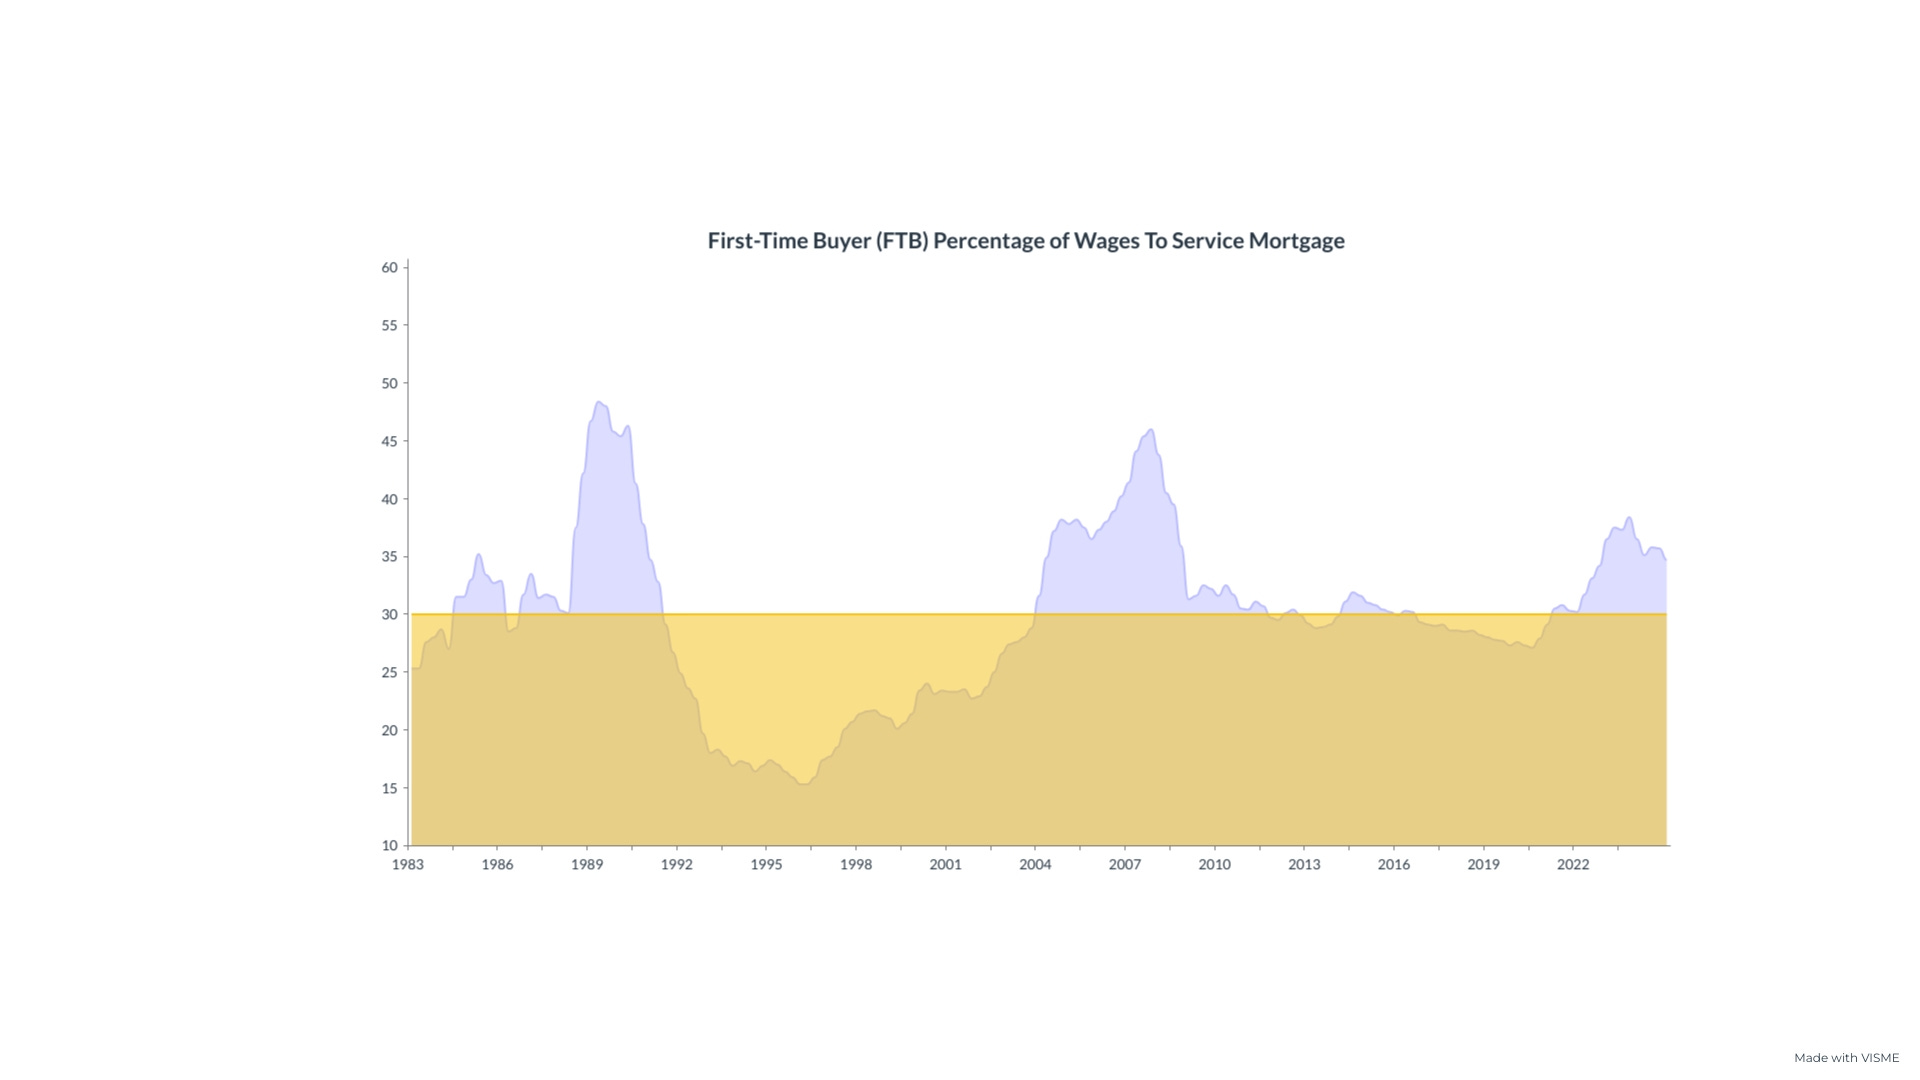
The above graph shows the yellow line at 30% which is the long-term average percentage of a FTB take home pay needed to service a mortgage. Affordability has been improving since 2024 but still remains historically more challenging for buyers with 34.7% of a FTB income needed to service a mortgage against the historical average of 30%.
More revealing is when we look at the affordability broken down across the regions as this highlights a market with a wide range of potential for future price growth:
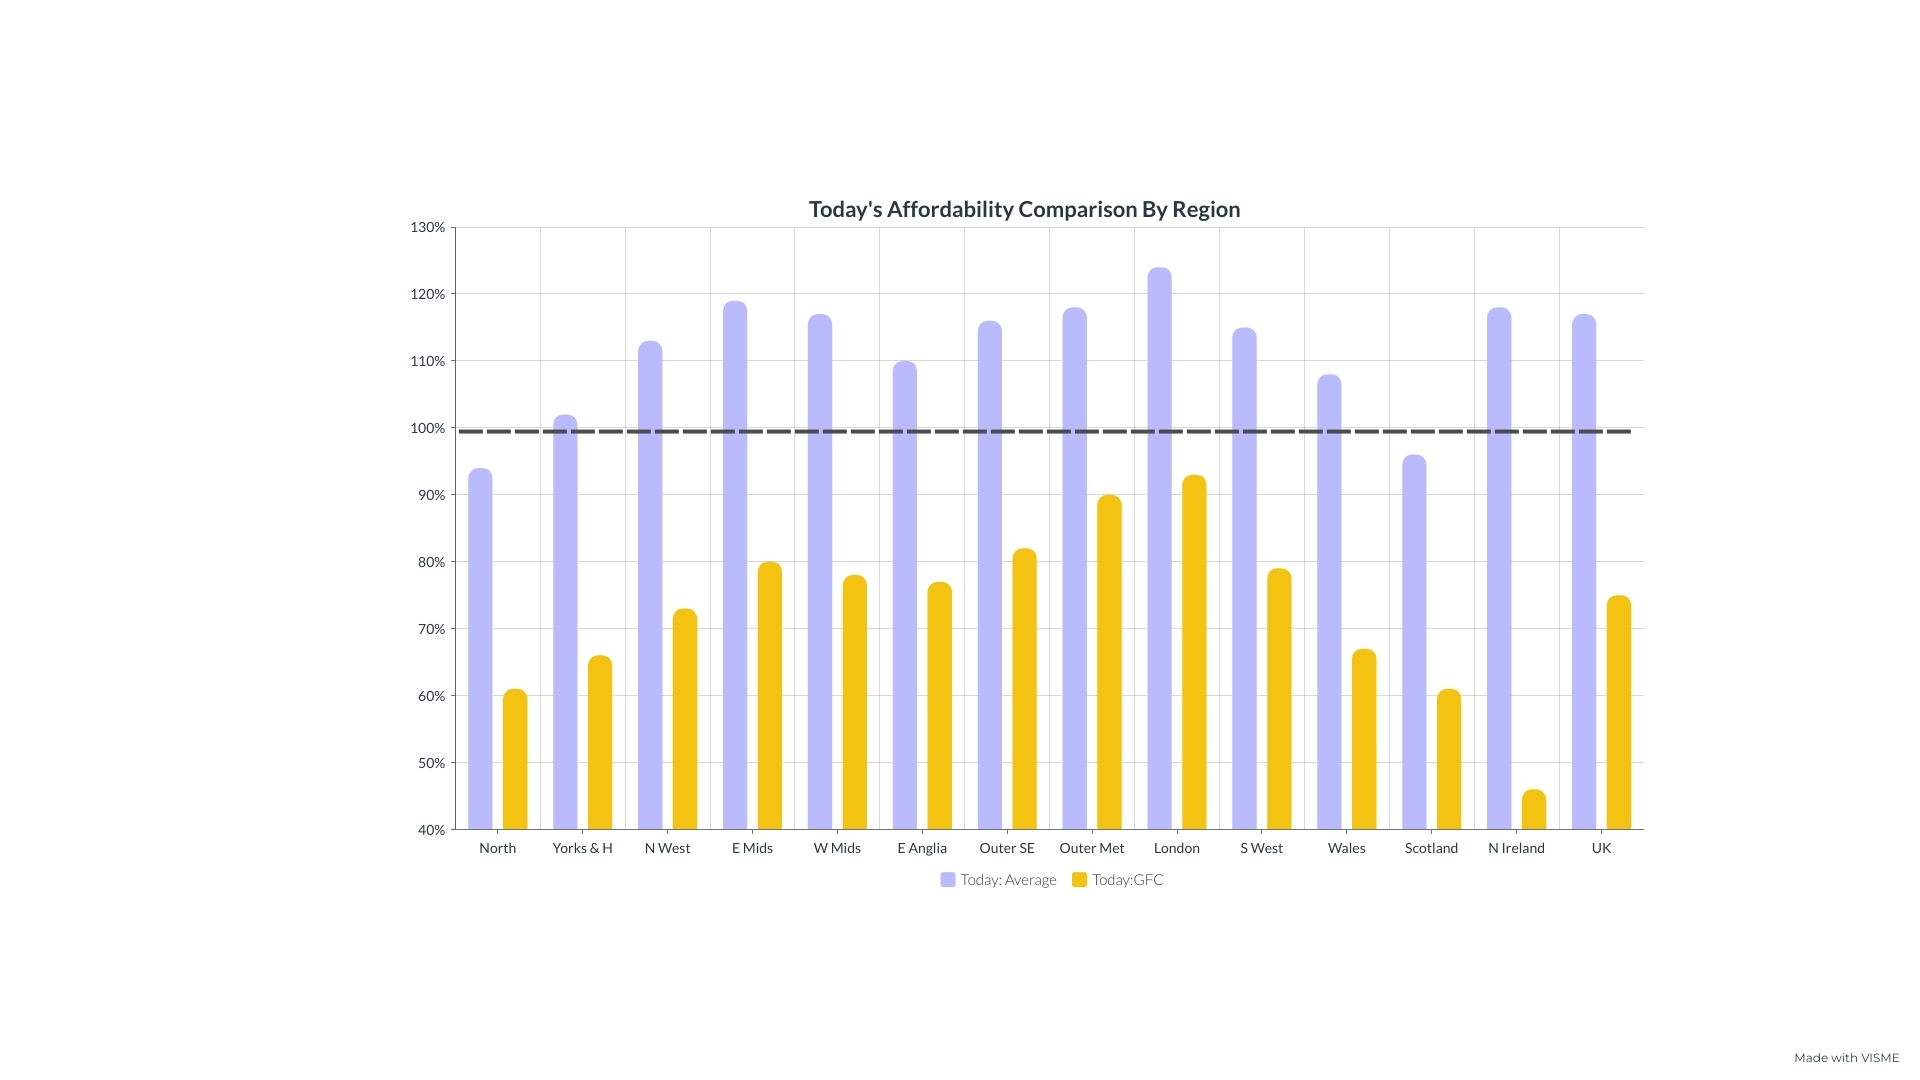
The lilac coloured bars show a measure of today’s affordability with respect to the long term average (since 1983) and the mustard colour bars show today’s level with respect to the peak of the previous cycle in 2007. If the bar is above the dotted line then affordability is worse. Taking the mustard bars, for the first time in many years, affordability in London has finally got better than was the case at the peak of the 2007 market. This is a very low bar, but shows some improvement in affordability the prime markets of the south. Looking to the lilac bars, most parts of the UK remain over their long-term average with London and SE still very stretched. This suggests very limited growth potential in these areas and perhaps even a further softening of house prices in real terms for the most stretched areas.
Conversely, the north of England and Scotland are below their long-run affordability averages. These areas show very positive signs for house price growth in the near to medium term.
Thinking about how affordability is likely to change in the next year, the Bank of England are forecasting 2 or 3 rate decreases in 2025. Additionally, wage growth is double that of the rate of inflation. These factors combine to allow for affordability to drop back to average levels in the next 12 months or otherwise some real terms house price growth should buyer confidence in the market improve.
So, What Should We All Be Doing?
A score of ‘1’ means we need to be taking time to pick out the very best deals to buy. This may mean travelling far from your usual investment area and even then missing out on deals whilst you research them fully rather than jumping in. A score of ‘1’ still indicates a market which is uncertain in terms of short term direction so it will be low-ball offers, units which offer value-add potential and turning down more deals than you proceed on that will be sensible.
And Now, For Something Completely Different
At this point in the blog, we usually offer up a few ideas from Rightmove to go buy, sell or hold. However, we offer a different option this quarter - indirect exposure into the property market via listed property company shares. For investors who follow the property sector, Housebuilders and REITs are an obvious way to invest in a passive way whilst retaining access to the capital that share liquidity offers. Property investors will have good insight into this sector and should do well as a result. Whilst this may not suit someone full-time in the property industry (possibly a developer) for everyone else this is worthy of comparison with direct investment and it can fit to any budget from £10 upwards. This option is especially attractive if aged say 45 or over, investing in property-related shares via a SIPP could be a very profitable way of accessing the UK property market in a hands-off fashion whilst getting access to the capital fairly soon once you reach minimum retirement age of 55 (soon to be 57). In other words, investing in a SIPP for no longer than a typical hold period in a direct property investment. Investing via a SIPP gives a 40% boost of the invested capital for higher rate taxpayers via the tax relief this vehicle offers. This can make this option highly compelling and up to £60,000 per person is possible to invest this way in any tax year.
Timing Share Purchases
We can use the trusty Buy, Sell or Hold model to time the purchase and sale of the shares just as we do with property. One way would be to just buy housebuilder & REIT shares when the model produces a positive score and sell them all as soon as we get a negative score. Share ownership is so much more liquid, we can actually act on the Buy, Sell or Hold model immediately.
Looking over the last 40 years, the model would have indicated the following 2 main investing periods using the above method:
Period 1 - Buying each quarter from Q1 1992 and selling it all in 2004 Q4
Period 2 - Buying each quarter from Q2 2013 and selling all in Q2 2022.
How would have this played out in reality?
Let’s take the price history of the UK’s biggest house builder to see how their share price performed (including re-investing the average annual dividend of 6.2%):

Period 1
Buy - Share price in 1992 Q2 - 35p
Sell - Share price in 2004 Q4 - 376p
So total annual return from 1992 - 2004 inc dividends = 28% pa
Period 2
Buy - Share Price in 2013 Q2 - 252p
Sell - Share Price in 2022 Q2 - 500p
So total annual return from 2013 - 2022 inc dividends = 14.1% pa
The above returns are roughly in-line with that of a 75% LTV leveraged Buy to Let investment over the same period, but without any of the hassle. If you invest via a SIPP and factor in the effective 40% added in year 1 due to tax relief, the returns will have been far superior. For doing nothing.
This all sounds too easy….
So What?
For investors who have a better handle on the property market than the average Joe (that’s you dear reader) consideration should be given to making hands-off indirect investments in assets like house builder and REITs as well as direct investment. Direct investments have some advantages up their sleeve such as forcing appreciation through capital expenditure, if this is your job such as a developer then your work can still be very well-rewarded. However for investors making regular investments and looking for a more passive journey then we have much to consider here.
Would it be best just do as the example above, follow the buy, sell or hold model and just invest in one housebuilder stock when the model initially says “buy” and sell at the first sign of a “sell” recommend? Of course not. Better would be to adopt the dollar-cost-averaging method and invest according to the buy, sell or hold model every quarter where there is a positive ‘buy’ recommend. In addition, investment should be made across a range of the house builders based on their market cap size. And why not throw the odd REIT into the mix. Here are some ideas to get your research going:

The table above gives some ideas from the biggest of the listed housebuilders and also a residential REIT. With this quarter’s buy recommend and the listed shares being cut in half since their previous market highs and with good dividends, then this type of investment deserves a deeper investigation. I hope all that has got your mind buzzing. A rare departure for us from Rightmove, usual service will resume at end of Q2.
Conclusion
I will finish with this. 5 years ago, the government told us not to leave the house and we could not even view any property due to CV-19. Apart from that time, the UK property market feels as ‘odd’ as it ever has done to me since the early 1990s. Rents are high but landlords are leaving in droves due to government interventions etc and property inventory levels are creeping up. Sentiment on the streets feels rock bottom and you are an estate agent’s best mate if you walk through their door right now. If you are brave and out buying when we have a score of ‘1’, it means you should be securing very good deals and way below the price that of the Nationwide average. When sentiment is so low, this is the time when the low-ball offers get accepted. All this while mortgage finance is increasingly plentiful and interest rates stabilising. I am sure we will look back on 2025 as a lovely old time to stuff your portfolio with prime-located goodies. Readers, good luck.