


Property Investment Almanac - 2025-2035
The Monkey's getting drunk once more

We are just through the season where the various pundits have made their property price predictions for 2025. Whilst making a 12 month forecast on property price each year is fun, it has the problem of generally being 100% wrong and also of being of 0% value to an investor. What investors really need is an idea of how different areas are likely to perform relative to each other over the medium term, ie the likely hold length of their investment. Therefore, knowing how property values in certain areas will develop over say a 5 and 10 year horizon would be a very handy thing. So let's try and do that right here.
As you read this blog, have in your mind the film Back To The Future 2 when young Biff gets his hands on The Grays Sports Almanac 1950-2000.
 in Back to the future 2 | Spotern")
Read on and by the end you will have exactly this data to hand not for sports results but rather for the how the UK property market will perform up until 2035 and will as a result make millions, retire early and buy a hoverboard.
This is not our first rodeo, we had a stab at this exercise back in 2014 using a notional drunk monkey throwing darts at a wall to make predictions as in this blog. The price back in 2014 for the target cities was:
London - £361,400
Edinburgh - £201,852
Cardiff - £165,637
Birmingham - £137,983
Manchester - £125,362
Leeds - £141,634
Nottingham - £106,198
Aberdeen - £182,357
How did we do? The results for the forecast property value and the actual value after 10 years are below:

In making this forecast 10 years ago we just used the principle of mean reversion, nothing fancy. Basically, areas which had done well for the previous decade we predicted would under-perform and vice-versa. In fact, it was really a joke to show how bad the property expert’s forecasts were compared to the proverbial drunk monkey throwing darts at a dartboard. The correlation of the forecast and actual outcome at around r=0.9 was really encouraging, even where we were off for Aberdeen. With Aberdeen, we still had the city’s relative position correct (ie predicted the lowest growth) which would have informed any investment decision at the time. Was the prediction in 2014 actionable? I followed the prediction with our own investments to the letter last time in 2014 and off-loaded 30 units in Aberdeen and took the winnings to Leeds and Nottingham. I am very glad I did. Thank you sloshed simian.

Last Time Was a Fluke
Let’s have another stab at this exercise and see if last time was dumb luck. We’ll try to do even better this time by using a slightly less pissed-up primate, applying additional investment principles like momentum and value (relative to historic prices). I intend to follow the results of this to the letter again in terms of buy and sell decisions as before and everything we do will be in line with ‘The Almanac’ from now until 2035.
If you are short on time, here is the key table from the Property Almanac 2025-2035. Print it out. Put it in a bag. Make off in a flying car powered by Mr Fusion. [I may have watched Back to the Future with my boys a few too many times].


That’s Just Numberwang - Show Me The Working Out!
Timing
Unlike in 2014 when the current cycle had only just started, this forecast is a good deal more uncertain as we are likely to encounter a downturn in the next decade - but when? It’s an impossible task to pin-point a downturn with any degree of accuracy but let’s go ahead and do exactly that.
First off, is a market collapse imminent? We take a view on this each quarter in the buy, sell or hold updates [the latest is here]. In these updates, we look at the relative and historic value that today’s property market offers. A key metric used is the affordability for the notional first time buyer for a property today. For ease, the chart is replicated here:
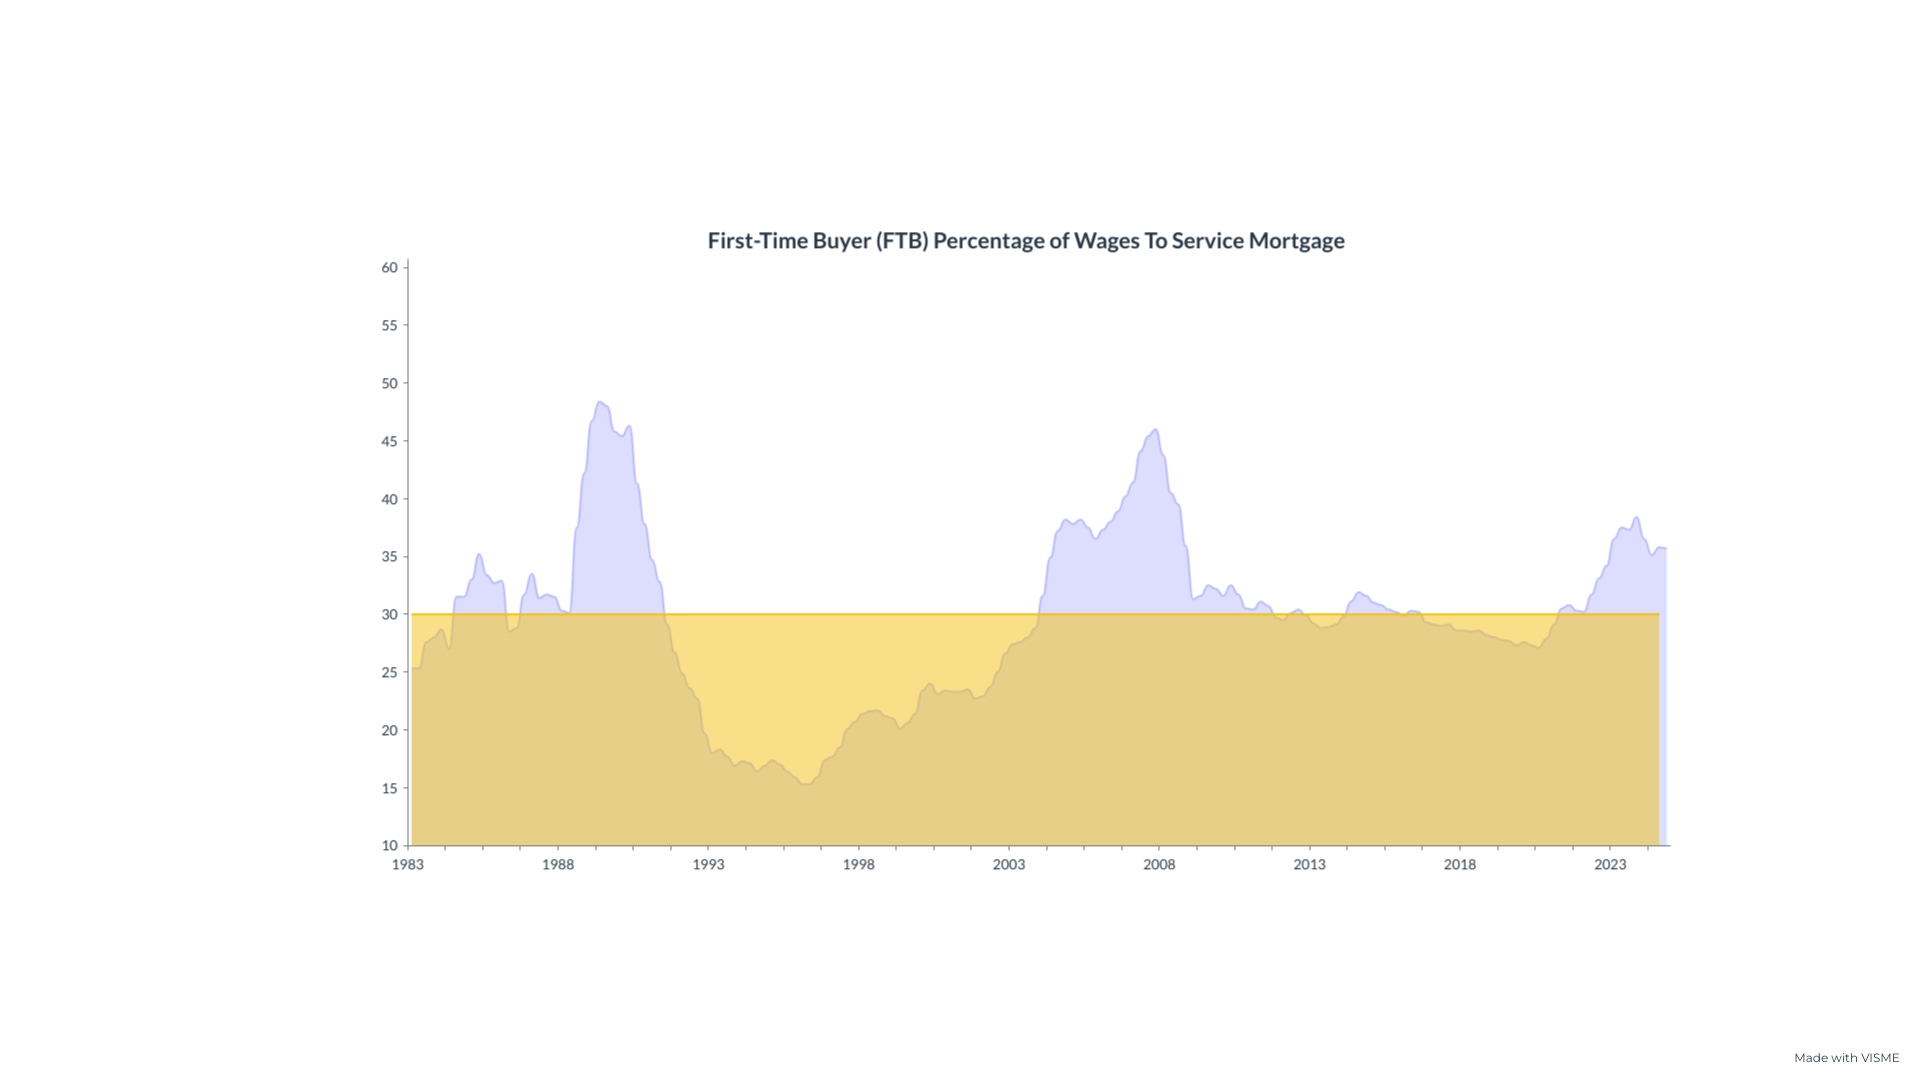
From the above, we see the FTB affordability with the yellow line showing the average since 1983 and the 3 peaks above that in 1989, 2007 and 2023. We will talk more about the height of these peaks later but the most recent one is much lower than at the point of the 2 previous market crashes and is falling now.
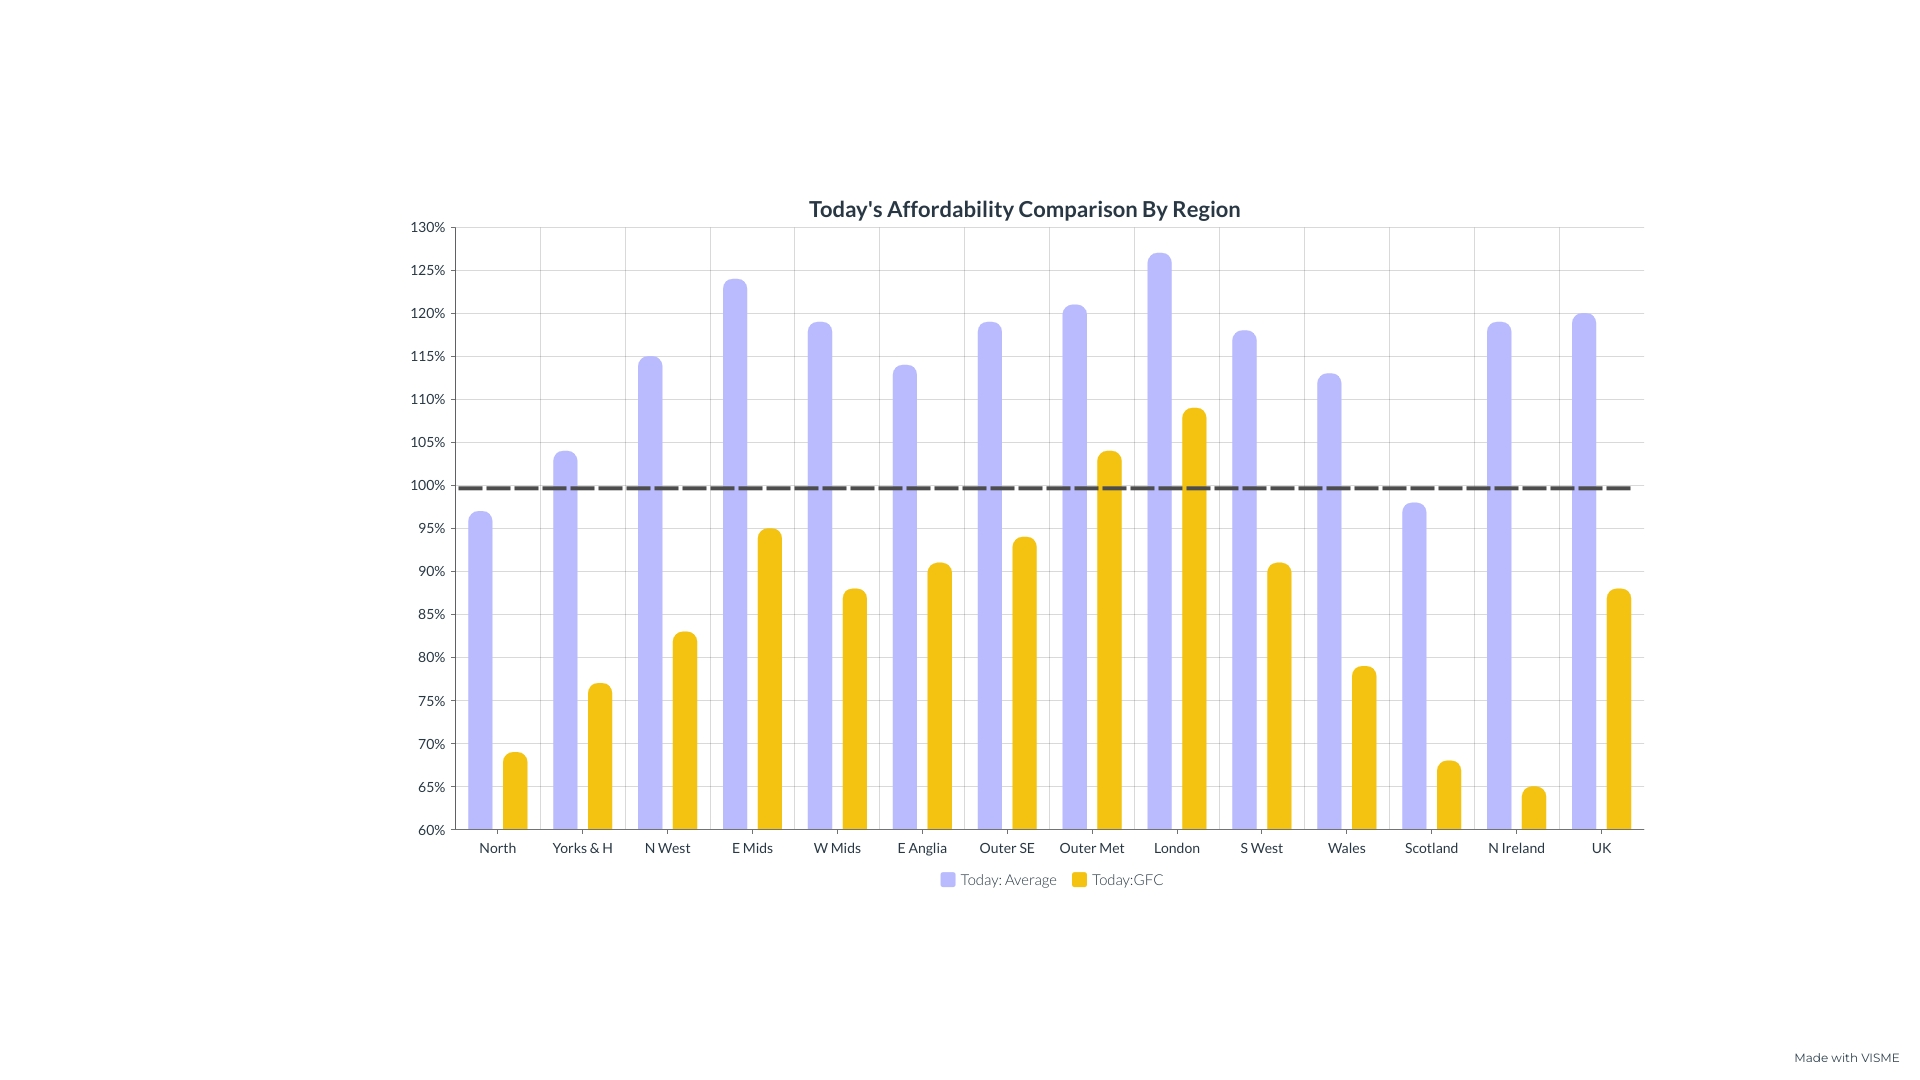
The above shows each region / country’s affordability compared with the average level and also at the point of the previous market high. Looked at on a regional level we see that most regions are somewhat elevated above the average whilst some regions are actually around the long-run average or even more affordable than the norm. Affordability therefore remains slightly stretched but has been easing for the last 12 months. Therefore, unless interest swap rates for 5 years or less shoot up, a market crash in the short term seems very unlikely.
So, a market crash is not due immediately but how can we at least try to find a fundamental measure of when the downturn may come?

The above is the current guess at what the 3 month duration swap rate will be out until 2035. This is effectively the market’s guess at the cost of short term money each month for the next decade. Whilst the graph is not intended for this purpose, we can say where the graph flattens and starts to tick up is when the economy will start to overheat, rates increase and potentially a property market correction or crash will occur. There is no real better measure than this, sure there are models like cycle theory but they can be imprecise at best in terms of market timing.
So from the above swap rate curve, we can say that the property market should increase in value as rates fall to 2029/30 and at that point go through a correction of some sort. Does that seem sensible to you? We can all agree that the market regularly sees a fall and we have not seen an appreciable fall in nominal property values in UK since 2008 so a pull back is due at some point. As the market is cool right now (it has just come off 16% in real terms since 2022) then a build up in prices is needed and 2029-30 seems as reasonable a guess at this as any to give time for this to happen.
Therefore based on this framework, for our forecasts from Jan 2025:
5 years - We will be just at the current cycle peak or just into a downturn period.
10 years - We will be well into a recovery from a downturn.
Strength of Growth In This Cycle - This Time It’s Different
So we have already set out a framework for the timing, now we need to make a prediction on the magnitude of growth. As the current cycle play out, we can say (with a straight face) that this time is different. We need to look back to the FTB affordability once more to get a sense on where we are now in terms of pricing and how elevated we are. FTB affordability measures the amount of take home pay used up to service a repayment mortgage. At the height of the last 2 market peaks this hit 48% in 1989 and 46% in 2007. Factors which will affect this affordability include prevailing mortgage rates, wages rates and mortgage policy. For mortgage rates, I will assume we will run into the peak at levels around 4%, in line with the swap rate curve above. On wages, the OBR is predicting around 2.5% per year wage growth from now until the end of the decade. This small reduction in mortgage rates from today will improve affordability as will wage rises.
Finally to mortgage policy, at the margin we have seen banks offer longer terms for mortgages which again will support affordability for higher house prices. But finally where things are very different this time are the introduction of the stringent stress-tests implemented after the 2007 banking crisis. We saw the effect of these for the first time after the Liz Truss budget. Rates soared and the housing market was fully priced with no chance of house price increases despite a severe supply-demand imbalance. The stress-tests did their job and choked off any further lending at higher prices despite the latent demand due to the housing shortage. The demand instead poured into an already hot rental market. In the wake of that budget, affordability worsened and finally hit 39% whilst prices remained broadly static. Therefore, for mortgaged buyers, it seems impossible the market cannot peak as high as previous cycles in terms of affordability and around 40% is probably the upper limit now (unless stress-tests are watered down or removed). We can say, now mortgage stress tests are in place, it is very unlikely house prices can peak as high as in previous cycles so we should not expect a huge run up now to the end of this cycle.
All these factors combine to support a rise in the UK average house price of around 30-40% from now to the peak of this current cycle. With the average house price on the Land Registry currently at £291,000 this would indicate a market peak of around £390,000 in 2029/30. In terms of the likely subsequent fall from the market high in 2029/30, again the mortgage stress-tests will lessen the extent of the drop. In the previous 2 market pull-backs in 1989 and 2007 falls of 20% were seen across the board. This time, due to more stringent lending criteria, I will assume we will see drops of 15% in nominal terms before a period of recovery from around 2032-2035.
So now we have made a claim to how the market will perform over the next decade, we are finally in position to make our 5 & 10 year forecasts.
5 year Forecast - January 2030
In the wake of the pandemic with the Bank of England money printer working overtime, most parts of the UK market had momentum up until the Truss budget in Sep 22.

At that point the market started to react differently as the higher interest rates were digested across the country. In the below map of England & Wales, we see that parts of the midlands and north have powered on through what has been a tricky market with most of the south, south west and east struggling.

In the next couple of years we would expect this momentum to continue as the market normalises to the new interest rate environment. However, this effect should subside over time. The cities in the orange and red will initially do well but running up to the market peak around 2030 will require us to take other measures of value rather just momentum into account to make our 5 year prediction.
A very good measure of this is the ratio of each city price versus the UK average over time. This gives us an idea of how well a city does, relative to the average of the market, as we pass through the cycle. If we look back to previous cycle highs, we can use this ratio to suggest how much further a city should develop up until the end of the current cycle. This bit gets a little complicated so let’s use an example.
The next graph shows this ratio for the nearby northern cities of Leeds and Manchester.

Above we see at the start in 1996, the ratio for Manchester:UK Average is 0.58 and Leeds:UK average 0.81, so quite a gap. We then move onto the market peak in 2007 where Manchester hits 0.74 and Leeds 0.85. This is a significant ratio, it shows the fortunes of the cities at the peak of the market when confidence is the highest and banks and consumers are all-in. Interestingly, this gap between the cities then closes over the current cycle, particularly from around 2015, and the cities end today at an almost identical 0.87 & 0.85 respectively.
How can we use these city ratios to predict the performance of the various areas for the next 5 years? Firstly, we are assuming that we reach another market peak around 2030 so all things being equal each city should return to the ratio it held versus the UK average in the Aug 2007 peak. For each city, this comes out as:

Remembering from earlier that we are predicting a 35% average UK house price increase in 2030, we need to correct each city’s fortunes for the ratios above. For Leeds, this is easy as the ratio now is the same as in 2007. So for Leeds we will expect 35% increase in the next 5 years. For Newcastle, we should expect faster growth than 35% and for those cities above the 100% line we should expect more moderate growth. Still with me?
I used the phrase ‘all things being equal’ above, we need to also correct for this as all things are not equal. If all things were equal between cities this cycle then the ratios would move relative to each other and all this would be easy-peasy. But clearly from the Manchester Vs Leeds plot we know this is not the case. If something systemic has changed (good or bad) in a city during this cycle we need to account for this in our forecast. In the case of Manchester, the city skyline has been transformed during this cycle and this development has pushed the attractiveness of the area and in turn the property values relative to Leeds and the UK average.

So we need to look to each city to see if a correction factor needs to be applied to the growth forecast that would otherwise just be dictated from the city ratio now versus 2007. For example, in the case of Manchester the predicted growth initially is 12% but corrected to 25% to account for the systemic change experienced this cycle. The results once this correction factor is considered are below:


There is huge uncertainty in this prediction, not only due to how the economy will play out in each city for the next 5 years but also the timing of any market peak. Let’s check in with the grown-ups and see how we compare with how the forecast from Savills, Bank of England etc.
Predictions from Savills, Bank of England etc
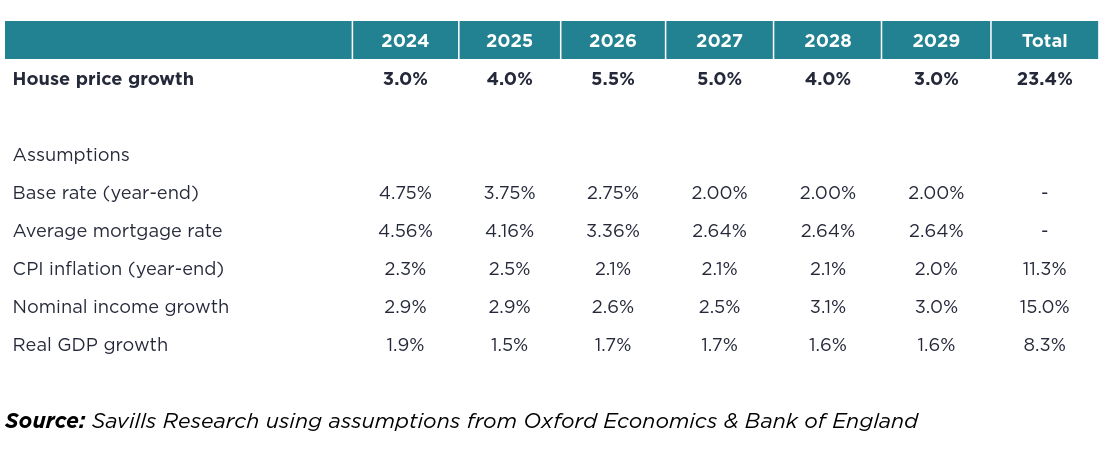
On house price growth, overall we are not too far apart which gives some comfort even if these guys are often very wrong.
Would I bet the farm on our results above, like we did in 2014? Actually, yes, even if the predictions turn out not that close. I will certainly be acting in line with the relative growth forecasts, for example if I were looking at making a fresh investment for a short hold period then Newcastle would be an area I would be looking within rather than London or Bristol. To inform a hold or sell decision, I will be setting targets for our own holdings in line with the above and as we approach these values will prepare for disposal of these fully-priced assets.

10 Forecast - Jan 2035
With the 5 year forecast in the bag, we turn ourselves to the 2035 prediction. Why don’t we just do what we did last time in 2014 for the 10-year punt, that worked out well?
Looking at last 10 year performance and apply the ‘drunk monkey’ mean reversion ideas such as we did in 2014.

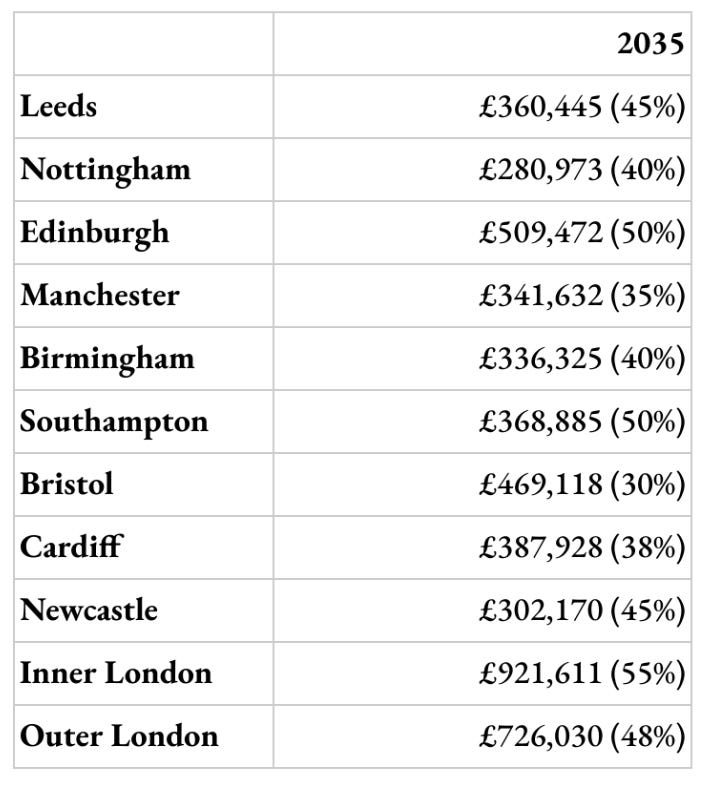
If we use just the mean reversion idea then we would place bets on London and Southampton coming up trumps over the coming 10 years with the northern cities trailing behind. Whilst the same logic holds true as it did in 2014, unlike last time we have the small matter of a likely downturn in the middle of this 10 year prediction. To make our prediction accurate we must take account of our 2030 predicted values above, discount these for the likely downturn of 15% and then plug in the strength of the recovery phase that is likely in line with the above graph. So, finally, we get:

You Sound Very Confident About All This Mat
Making a claim to know the future demonstrates the arrogance of us investors. But this is the job, we don’t have a choice and I have tried to lay out my best stab here to you as things are set in 2025. However, we need to use one last investment technique to test our prediction - the ‘garbage can’ model. This is actually a decision-making model but we can again misuse it for our purposes. We just throw into the conceptual bin the above forecasts and then think about all other plausible outcomes to 2035, ones not fitting your world view. And then throw them in the bin as well. With all inherent bias stripped away, we then try to pick out of the bin the bits which still make sense and meld them together as best you can.
You can do this exercise as I am sure you have been reading this blog and find some other outcomes of your own more plausible. Write them down, and throw them all in the same bin. I have a few I could throw in, the biggest being the timing of the end of the current market cycle of 2029/30. I keep coming back to this graph and it nags me:
In 5 years time we may look at the above graph and conclude that it was in fact obvious that Aug 22 marked the high point of the UK property cycle. Whilst the peak is lower than the 2 previous market highs, affordability got really stretched and could not go higher due to mortgage stress tests brought in during this cycle. Whilst nominal property values have gone sideways since this point, real terms values have tanked almost as far as in 2008. There is a possibility that the market did actually peak in Aug 22 in UK and we are now just entering the recovery phase. Anyway, put that idea in the bin.
How the market actually performs in 2025 & 2026 will provide answers to this, if we start to get strong annual growth above 5% then the Almanac should be correct. If we get slower growth in line with a recovery phase of the cycle then expect a red-faced embarrassing amendment to this blog in late 2026.
That’s All Very Clever - But What Will You Actually Be Doing Mat?
Readers, I promise to follow this forecast and act on it to the letter. Our holdings in Leeds, York & Nottingham have all done fairly well (not epic) over the last 5-10 years. Currently, they do not feel overvalued but any significant growth in next 3-4 years will mean they have done their money and we will dispose of the lot. If we do decide to buy this year, we will look to cities like Newcastle for a shorter anticipated hold period before any downturn. We aim to have our entire current portfolio disposed of for sure by around 2029-2030 and will go all-in on Inner London and move to the prime regional markets as the recovery takes hold. Of most interest would be any distressed build-to-rent schemes, allowing us to buy in scale for the first time since our Germany exploits. So that is what we will be doing, adjusting along the way as the market develops.
And so the question back to you, if you have nodded along to the logic above, what do you plan to buy, sell or hold over the coming decade? Are you currently all guns blazing or are you holding off on new investments until after a downturn? If you currently have places like Manchester or Bristol in your portfolio and done well since 2014, are you planning to prune these off and re-plant the money in more fertile areas? We have referenced just a small list of properties in this blog but why don’t you run a similar calculation on locations of interest to you and see how they benchmark? Few investors make such brave moves, naturally we get settled in an area or if you are supremely lazy you just invest where you happen to live and never sell. Having read the Almanac, what will you do now?
Sum Up For God’s Sake
The forthcoming decade has much more uncertainty than the previous one as we are due a market downturn at some point. The forecasting monkey needed to be more sober this time and has applied additional investment principles to the forecasts than just the reversion to the mean used in 2014. Whether that will turn out to be more successful, we’ll see. The key point is at what point a downturn will occur. It is possible that 2022 was the UK market peak but I have discounted that, for now at least. It seems unlikely that a market crash is imminent and 2029-30 was our best guess, but that is in truth all it is - a guess. Once the downturn happens then we will have a clearer view on the medium term, but for now this is my very best shot at making my 5 & 10 year punts in 2025.
Timing the market is not for everyone, in truth it is an impossible task to get 100% right. But as a value investor I apply the above approach to every asset class we are invested in as it's the only way I can rationalise our actions. Anything else just feels like pure speculation or worse acting lazily, investing near where you happen to live. Sometimes this approach even works. See you in Newcastle….