


One Question - One Answer

Investors wake up in the morning and have the task of answering one simple question -
"Should I buy, sell or hold?"
That's it, that is the only question all investors have to answer. Of course investors investing in shares on a high-frequency basis have to answer this question many times through the day, and I can imagine that must keep you busy and a little stressed. The property market on the other hand moves at a relatively glacial pace, us property investors should not pretend to have to answer this one question more than once every quarter. That is literally all we have to do and this is one of the joys of property investing. The only minor snag is giving an accurate answer to that one simple question. In this blog, we will arrogantly suggest a way of getting the answer right every time and prove it by going back 40 years and showing how this magic formula would have helped a property investor out for every single quarter. Crucially, the answer will be given with enough time to act in the slow pace housing market, effectively a 6-18 month "heads up" on the market. Pretty much life, the universe and everything being offered up - this may be the last blog I ever write.
First off, let's just remember why timing the buy, sell or hold decision is most crucial. If you did not catch the blog from May 22, please click this link. This was a little story of 4 investors who timed the market to more or less extent and the huge differences in their outcomes. They all invested £200,000 and the difference between the top (Mr Green) and bottom (Mr Blue) ended up nearly £4 million over the investment period, it is worth a read and hopefully makes the case well for trying to answer this one simple question well. What we need though is a tool to inform you what to do well in advance, a tool to capture the gut-feeling of the most successful investors. Just how do you become Mr Green?
Of course, this is not a simple task and will not just have one key metric to follow but I want to make this as simple as possible whilst incorporating all the key drivers of the housing market. To do this, I will use just one website for the source data and that is Nationwide.
And to keep with the simplicity, we will use just 2 data points from the Nationwide namely quarterly UK average house price and FTB mortgage payments as a percentage of take-home pay. These two data points actually incorporate all we need to know, the wage inflation and mortgage interest rates of FTBs who drive the market and the direction and rate of change in prices themselves. And finally, we can also capture the historic market performance and current inflation rate if we examine the Nationwide house price data using this model which is shown below:
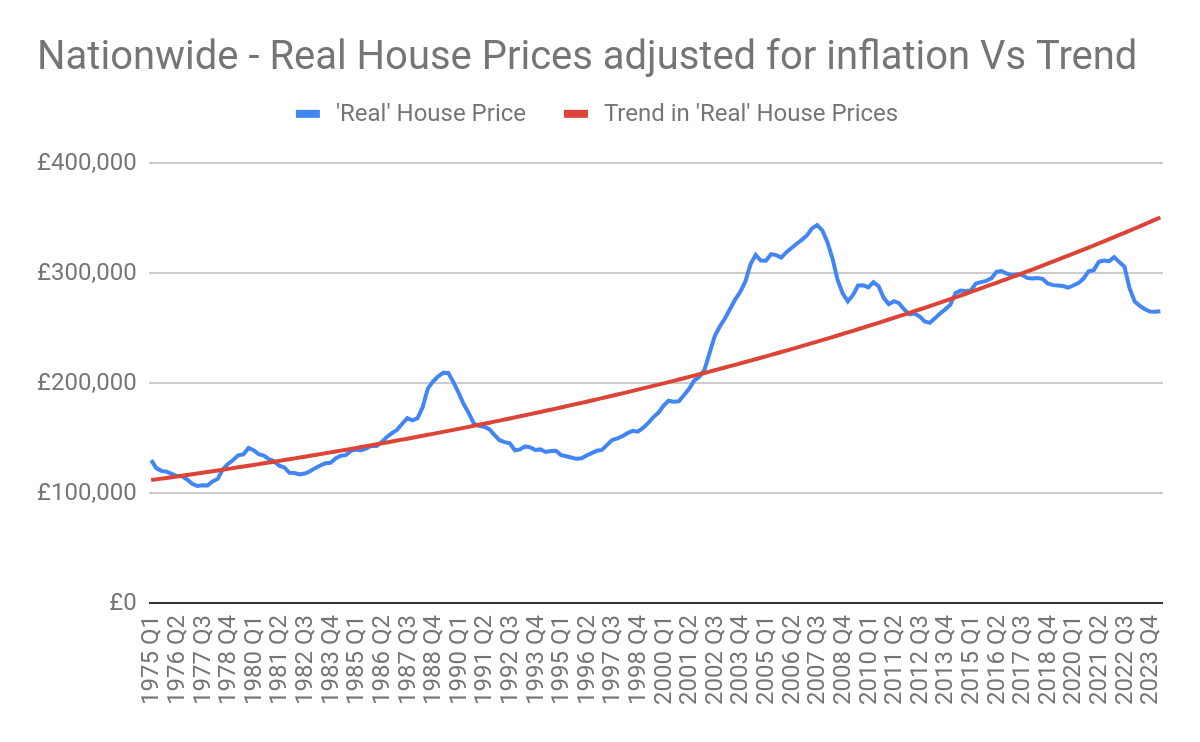
Keen readers of this blog and the books will have seen us use this graph as early as 2008 in our research. We keep coming back to it to help us time the market. Before we have merely mentioned that buying below the red trend line and selling when above will see you win but I am now going to put just a little more detail on this.
The Secret Formula
So, here it is. Remember, this is a secret so please only tell around 10 of your closest friends.
Firstly, using the above graph we work out (using the table of data at Housepricecrash) just how far above or below the red trend line we are. We record this each quarter as the data comes out. And next, we just note down the current percentage of take home pay a FTB needs to service their mortgage. That's it, just 2 bits of data which I then score as follows:
House price is 10% or more above the trend line - score is -1, 10% or more below trend line - score 1. In-between scores zero.
Mortgage Affordability - Less that 30% of take-home pay - score 1, More that 40% - score -1, in-between- score zero.
Finally, and sorry to complicate this, but one more score. It is important to make reference to the rate and pace of change in the house price with respect to the red trend line. So we check the change against the previous quarter price and score as follows:
A fall of -1% or more from the trend line - score -1, a rise of 1% or more on the trend line - score 1 and in-between score zero.
And then simply add up the score, -3 being the lowest through to 3 being the top. These scores are then rated as follows to answer the "Buy, Sell or Hold?" conundrum:
3 - Go All-in - buy everything, everywhere with all the money you can get your hands on.
2 - Buy swiftly in areas you are confident in
1 - Selective buying in clearly great areas you have researched.
0 - Hold. Boring. Wait. Do nothing. Keep looking at Rightmove for no reason.
-1 - Selective selling of your holdings and start planning future properties to sell.
-2 - Sell as swiftly into the market as is sensible, given tenancy lengths, mortgage redemption fees etc.
- 3 - Sell. Sell it all.
Answering the Question for the last 40 Years
Of course, we need a graph now so here it is for the Buy, Sell or Hold Question being asked and scored as above each quarter since 1983:

This is fast becoming my favourite graph, ever - pinch and zoom in to see it in detail. Let's look at each of the cycles in the above plot to see how giving a score each quarter would have helped. The source data for this graph is here, feel free to copy and paste this into a sheet of your own.
Cycle up to 1990

Sadly, we only have data for last part of this cycle. Those investors who remember this will have in mind the really rapid run up we got with annual rises reaching a heady 30% per year. Great gains were had but the aftermath was terrible for a decade, it was truly a market to sell into with hindsight. Looking at the scores, this model was giving strong evidence to sell from 1987 reaching a full on "sell it all" score of -3 by 1989. It takes time to sell a property, but this model did give fair warning from 1987 and to stop all buying from 1986.
Cycle up to 2008
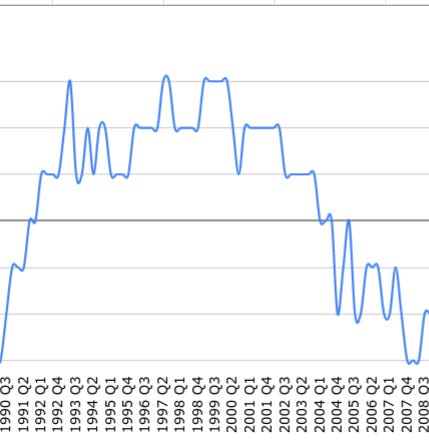
The model starts to recommend buying from mid 1992 with a fairly strong or "buy everything" score of 2 or 3 for much of the period until 2004. From here on the model then gives strong -2 scores for much of 2005-2007 before a "sell it all and run for the hills" in 2007 Q4. Perhaps that was a little late, price falls started in 2008 Q2 but at least you have fair warning to trim the portfolio down for some time.
Current Cycle
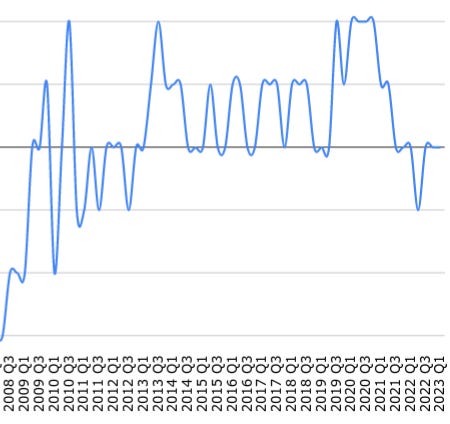
The indications have been far more muted in this cycle, some early "buy" scores in 2009 / 2010 but no firm direction until late 2012 when scores of 1 or 2 are frequent right up until 2021 Q1. Note how useful the model would have been in 2020 Q1 with the onset of CV-19 and the blind panic - the recommendation was just to calmly buy property! The model then from 2021 Q2 indicates a hold with actually a -1 "selective sell" in 2022 Q2 before returning to a hold for the last 3 quarters and that is where we are now. So the model now recommends, in what is quite a frantic / febrile market, a boring old hold.
So What??
This is a big and clanging 'so what?'. Just take a look at the graph above and remember what is happening here. You are taking just 2 data points from Nationwide, giving them a score each quarter (that will take all of 5 minutes) and then leisurely deciding what to do. Without any question, following this over the last 40 years would have given you a huge advantage over the average market and the "buy at any time and hold forever" investor crowd. All the big market moves are predicted and crucially with sufficient time to do something about it. The property market is slow, it takes time to buy and sell and this notice is crucial. Sure enough, the model might have recommended a zero-score hold at some periods when the market was good to buy (for example some quarters in 2004 and 2011 / 2012) but that would have not lost you too much in the grand scheme of things.
Another take-away should be the hold periods you should expect. There are no huge turning points from a high score of 3 to -3, looking at the graph it follows a more gradual glide-path and a hold period between 3-12 years should be expected. This may mean hopping between locations when times are good, some places will do well in the early cycle and some later on so some selling may occur in between. You could say a 6-8 year hold will be one to anticipate.
And finally, what do you think of the current recommendation of "hold" in 2023 Q1? To me, it feels about right. Some young, hungry investors may be out buying at the moment and no doubt some good deals are to be had. Equally, some investors longer in the tooth will be using this time to sell up after some gains over the pandemic. But the market is really quite balanced, if a little skewed to selling after coming off a strong buy score of 2 in 2020 Q4 and drifting down since.
What Next??
You could easily do some projections of your own to see what sort of scores we should expect over the coming say 3-5 years. Whilst that should be enormous fun, it will involve many assumptions on pay, mortgage interest rates and the like - really do you need to do it? Why not just patiently wait for the Nationwide data from the link above (next print is end of June) and just plan what to do from there. No crystal ball needed, no guesswork. Takes just 5 minutes every 3 months.
The one tweak you could make to match your own investor style (ie high or low risk) would be to adjust the parameters on each score. For example, a higher-risk investor would push the affordability percentage higher and this would give a higher score some quarters. Or you could decide to be conservative and just buy with a score of 2 or 3 or sell when the score is -2 or -3. This would still be very profitable and give plenty of times over the cycle to be active. I leave the tweaking to you.
But in the end, what we have here is the answer to the only question us Property Investors need ask ourselves and with evidence that it has been correct for the last 40 years. It is based on 2 simple data points which are easy to find and is more predictive than any other model I have stumbled across and gives you the time to act in the slow-paced market we all play in. Hopefully, boiling it all down to one number has not ruined the fun for you as an investor. You still need to decide the 'what' and the 'where', do I buy a HMO in Huddersfield when the score is 2 or do I sell my mansion in Mayfair when the score is -2 etc but at least the timing of these actions can be done with more confidence.
Look out for a quarterly review of the buy, sell or hold recommendations based on this model.
Finally to you, where do you see things right now - are you buy, sell or hold?