


2024 - Get Ready to Saddle Up and Buy

It’s the end of the quarter so time to score UK housing as an investment and help us make our Buy, Sell or Hold (BSH) decisions based on this model. If you are new to all this, please do look back at the BSH model and how it works.
We get constant predictions on future property prices in the media and they are so varied and actually of little practical use, so why is this model any different? We are not trying to predict market prices but merely trying to beat the average returns (so-called Alpha) of the market by answering the one simple question: “Should I buy sell or hold right now?”. See more here on what difference this makes.
We don’t do this every day, week or month. Property is for the lazy and is moves much slower. We just ask ourselves this one question every 3 months and this is what we are doing today as 2024 is just to begin.
Let’s cut to the chase, the overall score is this quarter is 0 so another big fat HOLD recommendation.
But let’s look under the bonnet of the model to see how things look for 2024.
Firstly, here are the quarterly recommendations from the model since 2012:

Since the start of this cycle, it has been a picture of mainly “buy” signals but from 2021 Q2 we have had just hold or sell signals. This has been a long period of sitting on our hands - is there a chance this will turn around in 2024 and we will be giving out a “buy” recommendation any time soon?
I really think so.
Remembering the scoring scheme by each component:
Real House Price - if 10% or more above the trend line - score is -1, 10% or more below trend line - score 1. In-between scores zero. Where are we this quarter? It is a very strong score of +1.
Check this graph of real house prices (corrected for inflation) versus trend:

The blue line of real prices in 2023 Q4 has fallen even lower now, we are actually 25% below the trend fair value. We are in very rare territory, only 1995-6 saw this sort of deviation over the last 50 years.
In simple terms, buying when the blue line is below the red trend line and selling when above would have made you very wealthy compared to just buying and holding. The blue line is likely to be 10% or more below trend for some time now so this component of the model is almost certain to deliver a score of +1 for at least 3 years now.
Right, let’s look at the next component.
Rate of change from price trend line
A fall of -1% or more away from the above red trend line - score -1, a rise of 1% or more on the trend line - score 1 and in-between score zero. This quarter we saw a fall of -1.6%. So it is a score of -1. Look back at the graph above, the slope (ie the first derivative in maths-speak) of the blue line is now flattening off. Therefore a score of 0 should be expected in 2024 and actually a +1 is possible from say Q3 as the market conditions and inflation settles.
Things are getting interesting! We should get +2 from the first 2 components very soon. What about the final component - can we even get to a +3 “buy, buy it all” recommendation?
FTB Mortgage Affordability - Less that 30% of take-home pay - score 1, More that 40% - score -1, in-between- score zero. This quarter it fell but was still high at 37.8%, so a score of 0. This graph shows this component over time:

The key inputs into this component are mortgage rates and wages. Looking at the above graph we see that whilst affordability has been stretched since 2022 Q1 when interest rates started their move upwards, this increase took us close to the upper limit of 40%. It has now crested and affordability, due to wage increases, is actually improving. Mortgage rates have moved little in this quarter but we have had recent huge drops in swap rates as shown here:
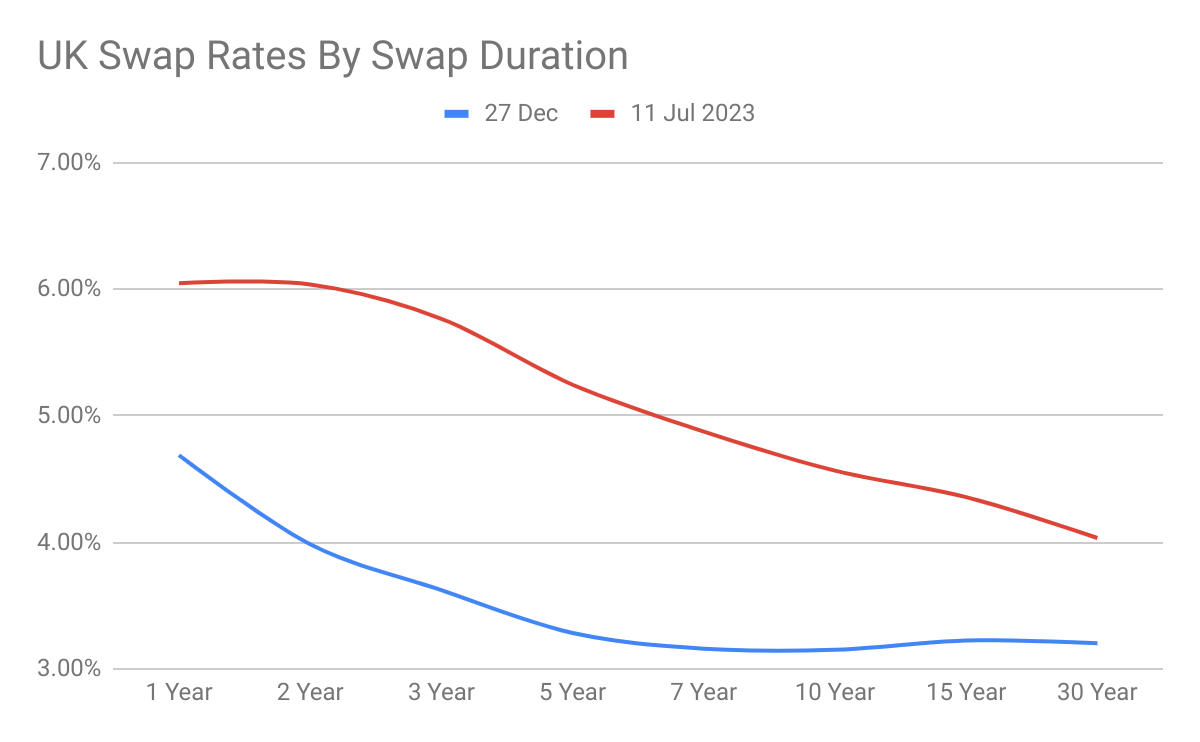
In just a few months we have seen a 2% drop in the swap periods that are the basis for the 3 and 5 year fix rate market. This is huge, and mainly happened in late Q4 as central banks dusted off the punch bowl in preparation for the well-signposted interest rates falls likely in the 2024.
Everything now hinges on if swap rates drift down now at the front end ( 1 to 3 year periods), but if they just hold their ground at 5 year and beyond period then we are looking at a very different mortgage market developing. As banks return to work in January a re-pricing of 5 year fix products especially should be seen, with pay rates around 3.5% for low risk mortgages in Q1. This will change buyer sentiment as we enter the key spring season. FTB affordability (due to the continued record wage increases) will improve and the amount of take home pay needed to service a mortgage will drop. It could even dip below 30% in late 2024 and a score of +1 will be possible. That’s a longer shot, maybe that will not happen until 2025, but the drivers of this final component are going in the right direction.
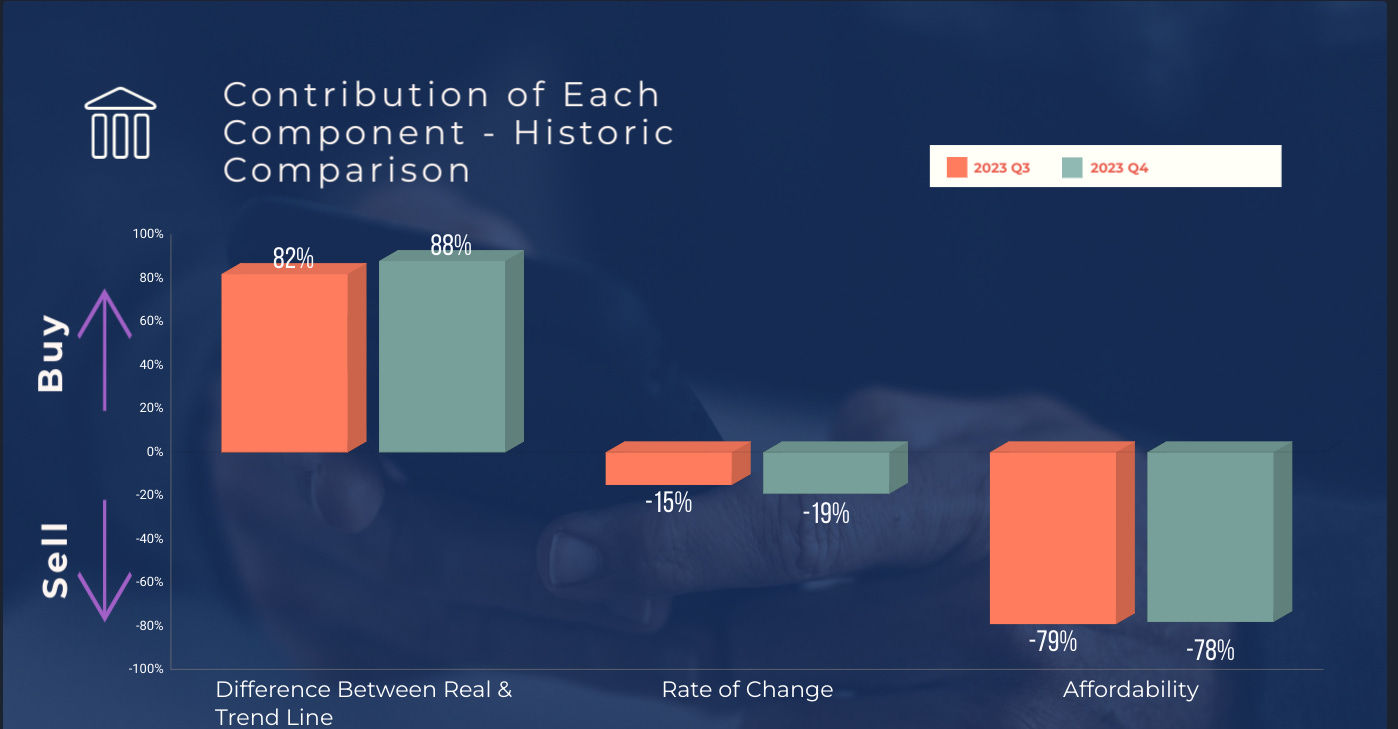
Finally, a look how each component is fairing compared to historical values since 1975:
Conclusion

I remain at my most excited for some time as a property investor. Whilst the model is not suggesting to go on a spending spree right now, all the components are either strongly positive or moving in the right direction. Barring something very odd happening (wars and pandemics no longer count as odd) then we should get a +1 buy signal by 2024 Q2 or Q3, moving towards a +2 or even +3 by year end.
Actions now therefore are simple:
Save every penny you can, in savings products with short tie-in periods.
Identify mortgages that are at a lower LTV and line them up for refinancing and release of equity when rates improve from Q1.
Get your credit score up.
Send a “Happy New Year!” email to your mortgage advisor and local estate agents. You should really be getting to know each other better in 2024.
Hi Tom, sounds like you are getting well prepared and good timing to have some dry powder in 2024. On the trend line, some musings on if are in this post. Nationwide refit the trend each quarter back to 1975 and it is now 2.4% pa above inflation. We have been using this graph since 2008 (it is in the first book) and back then it was 3% pa above inflation so it has come down a little. https://open.substack.com/pub/matsmith/p/real-house-price-trend-will-it-continue?r=2b1cj5&utm_campaign=post&utm_medium=web
Looking good. We’ve got a few refinances of cash apartments getting lined up, still seeing plenty of deals we can get our hands on here too. 2x HMOs are on the market, well offers accepted and with sols now. Game on.
I’d like to see some work around the trend line graph, how it varies if you alter certain aspects etc. I think I’ve just seen it for too long send taken it as gospel, questioning it seems appropriate. Happy to collaborate!